


December
About the Image
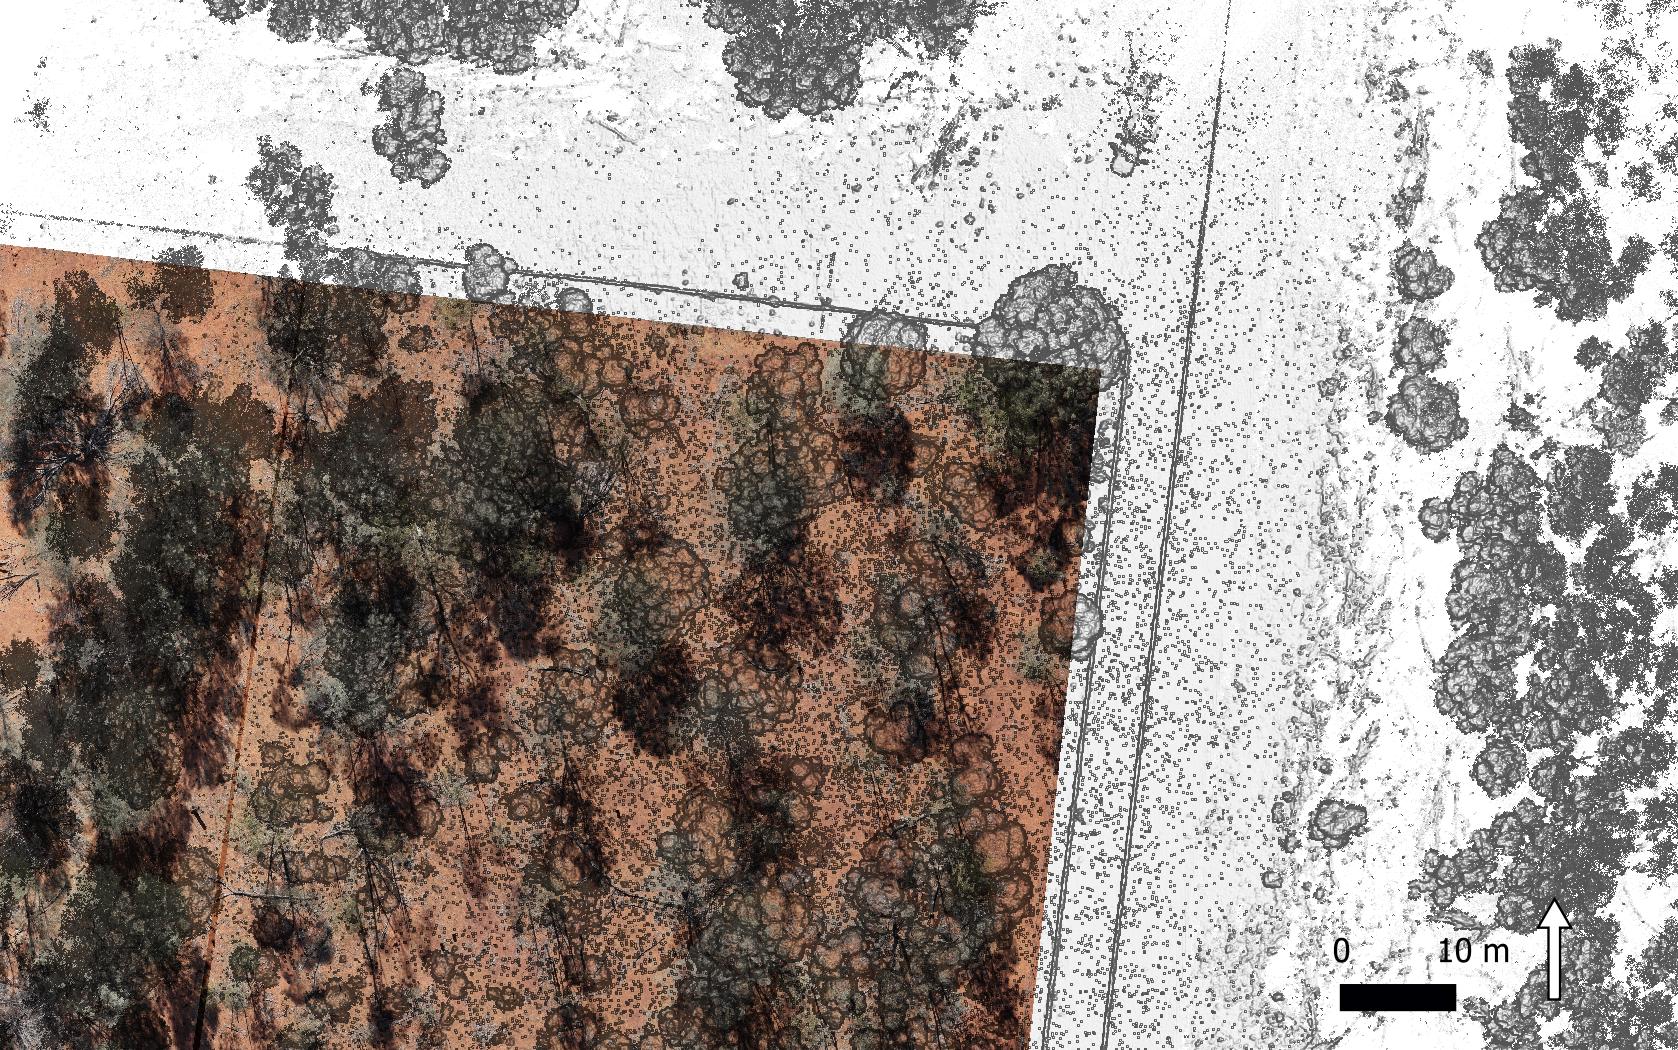
This image of the month is a combination of two images, acquired recently from a site in the Boatman locality of southern Queensland. First, a very-high-resolution image (1-cm pixel) was captured from a remotely piloted aircraft system (RPAS), commonly referred to as a drone. This true-colour image allows us to see, in detail, the features of the trees on the site: the foliage of mulga trees shows as green, exposed soil is orange-brown, and the dark features are either tree shadows or the decaying remains of fallen trees.
Partially overlying the true-colour image is a second image, in greyscale, collected from a terrestrial laser scanner (TLS). The TLS image provides detailed, three-dimensional information of the woodland stand. Specifically, this image displays the maximum height of objects across the landscape. This includes course woody debris, trees, and even the contours of the road, which is the linear feature running down the right of the image. The TLS sits on a tripod, where it spins around, emitting high-frequency bursts of light in precise angular intervals that reflect from intercepting surfaces. In this way, the TLS collects very accurate and high-resolution three-dimensional information of the environment.
These technologies are changing how Queensland’s scientists do field work, by allowing them to capture detailed, objective, and repeatable measurements of vegetation structure. Scientists use these measurements to relate vegetation on the ground to that seen by satellites.
The Changing Face of Fieldwork
The canopy area of 34 trees was calculated from the horizontal projection of six canopy radii. A circular sheet of canvas 3m in diameter, with a radial cut to the centre and a circular piece 0.75m in diameter removed from the centre, was placed at ground level around the selected tree bole. To facilitate the measurement of radii, 60o sectors were marked on the canvas. A surveyor's staff, or a 6m length of 2cm pipe, was placed vertically at the periphery of the canopy in line with one of the 60o sectors. The radius of the canopy at that point was recorded for each of the six sectors. (Pressland 1976).
Field measurements of vegetation structure have changed greatly over time, as shown by this methodological description for the site over 50 years ago. Recently, a group of ecologists from the original study revisited some western Queensland sites—including the site in the image above—accompanied by two staff members from Queensland’s Remote Sensing Centre. This time, instead of using steel tapes to measure tree heights and diameters, or canvas sheets to measure canopy area, they used a RPAS and a TLS. This technology enables the scientists to capture far more information, with more detail and greater accuracy, than could ever be done manually.
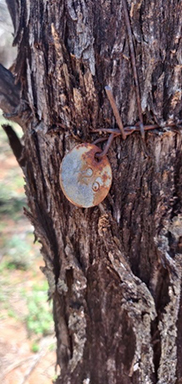
Of course, not everything can be replaced by technology! For example, several trees were tagged and measured individually when the site was set up in 1964. After several hours of searching the site, scientists managed to relocate over 100 of these tagged trees (image right). Locations were recorded using a GPS, and tree diameters re-measured. This information allows scientists to compare how the site has changed over the last 50 years. By combining modern technology with the diligent and detailed work of an older generation, today’s scientists can improve the understanding of these slow-growing trees…and maybe even gather the data that helps answer questions from future scientists.
Technical details
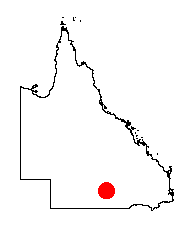
The true-colour component of the image was captured from a DJI M600 RPAS with a high-resolution digital camera (50 mega-pixel), to produce an orthomosaic image with a ground resolution of 1cm. The greyscale component of the image was derived from a Riegl VZ400i TLS; multiple scans were co-registered to produce a georeferenced point-cloud consisting of over 1-billion points. The approximate location of the image is marked by the red dot in the map of Queensland.
Reference
Pressland AJ (1976) Possible effects of removal of Mulga on rangeland stability in Southwestern Queensland. The Rangeland Journal 1, 24-30.