


April
About the image
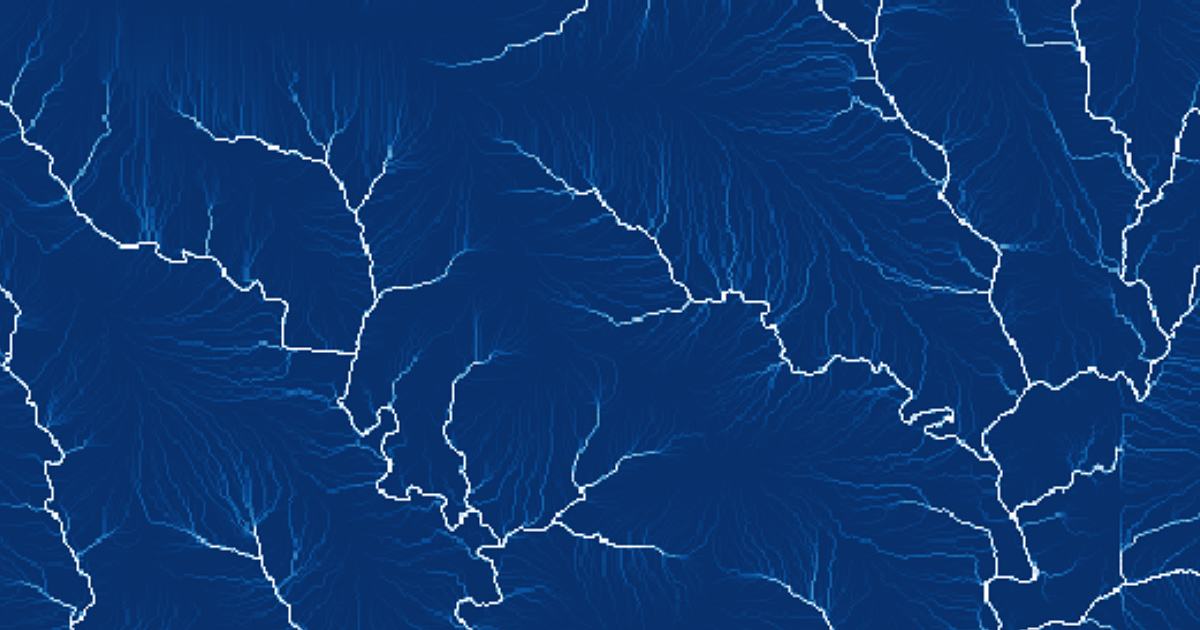
This image displays the modelled cumulative flow of water over a landscape, as the water travels from high to low elevations via gravity. Areas with less overland flow (also known as runoff) are shown in darker blue, while brighter shades of white represent greater accumulated flows. As drainage lines join to become rivers, the potential volume and intensity of flow increases. By modelling cumulative flows, we can map the likely downstream path of water as it travels from hilltops to river channels, before eventually reaching a drainage sink such as a dam or the ocean.
Mapping overland flow
The mapping of overland flow can help a variety of natural-resource management applications, such as soil erosion mitigation, and infrastructure planning. This is because changes in elevation, even subtle, can lead to the formation of concentrated channels of overland flow. Overland flow can detach and transport sediments, possibly leading to rill and gully formation. Soil erosion is a significant issue in Queensland, especially in catchments that drain to the Great Barrier Reef, as the erosion degrades farmland, downstream water quality, and marine aquatic environments. Understanding the movement of water and erosion risk will allow for better planning of the location and design of infrastructure (e.g., roads), as well as the movement of heavy machinery following rainfall.
Technical details
This image, gridded at a 1-m pixel resolution, was created from airborne laser-scanning data, gathered by using short bursts of a laser to directly estimate range from the aircraft’s sensor to the ground. By combining this information with the position and orientation of the aircraft, we can determine the exact location of surveyed targets. The data acquired can contain millions of dense samples of the Earth’s surface, which can be used to characterise a landscape in three dimensions. This includes capturing fine spatial detail on the ground, typically at sub-metre height accuracy, stored as a digital elevation model. Deriving such detail on the ground elevation across hundreds of square kilometres allows modelling of secondary geomorphologic attributes, such as overland flow.
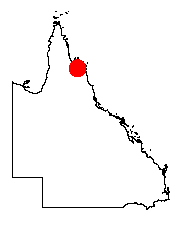
The raw airborne laser-scanning data used to create the image were collected as part of the Reef Trust 3D Terrain Mapping Services (Walker et al. 2021) and can be freely downloaded at https://elevation.fsdf.org.au/. The location of the image is marked by the red dot in the map of Queensland (right).
References
Walker S., Wilkinson S., Levick S., 2021. Metre-resolution gully and erosion hazard mapping from airborne LiDAR in catchments of the Great Barrier Reef. v1. CSIRO. Data Collection. https://doi.org/10.25919/7dsj-2r16.