


September
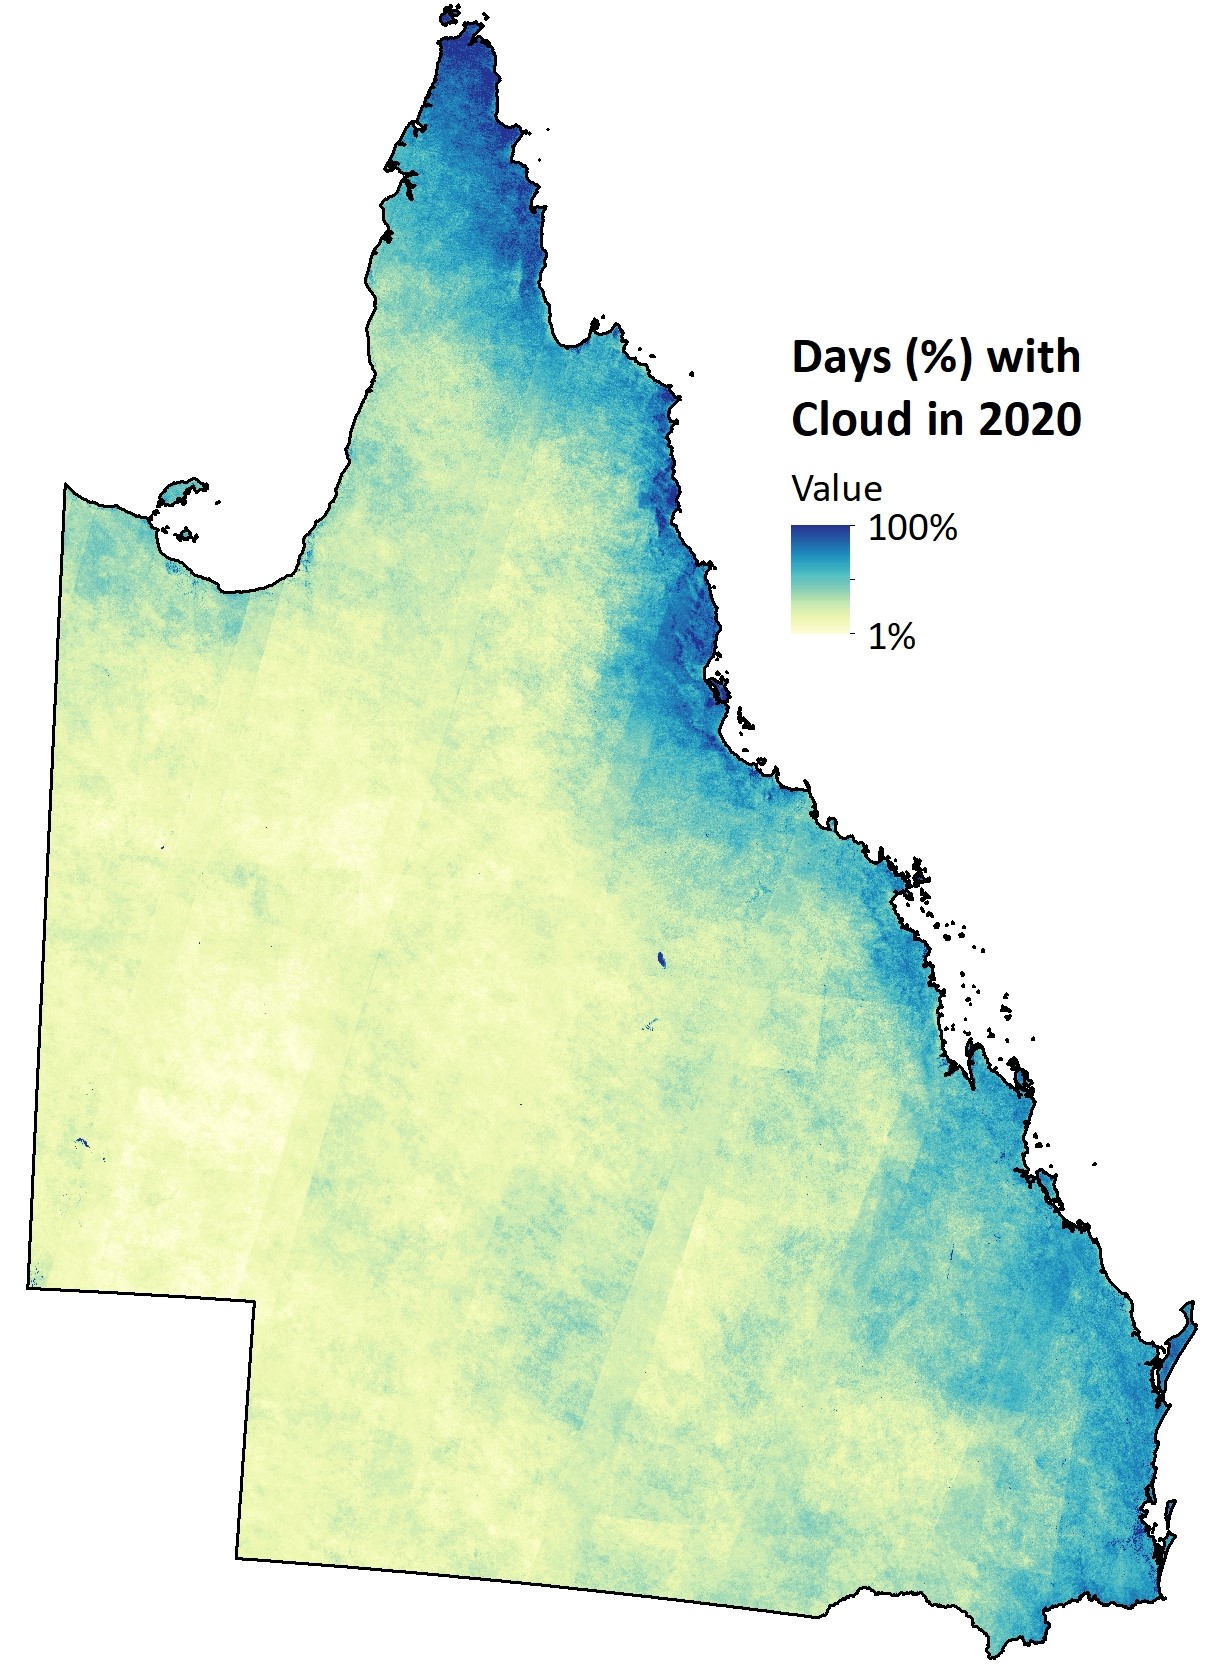
This image depicts the percentage of cloud-affected days that occurred in Sentinel-2 imagery for Queensland in 2020. The more cloud, the deeper the shade of blue. The image is a ‘mosaic’, i.e., it has been stitched together from a collection of smaller images. (View a larger version).
About the image
Clouds and cloud shadows can impact how remotely sensed satellite data are used for landscape monitoring. This image shows the percentage of days with cloud cover across Queensland in 2020, based on Sentinel-2 satellite-derived cloud masks. In the western parts of the state the light yellow depicts areas with very minimal cloud cover for the year (<10%). The dark blue areas on the northern coast show that most satellite images captured in 2020 had cloud cover, with some localised areas having upwards of 70%. Tully was Queensland’s cloudiest town, experiencing cloudy days for 76% of the year.
Clouds…a nemesis of remote sensing
Cloud cover is a major limitation for remote sensing, impacting the ability of a satellite’s visual and near-infrared sensors to view Earth’s surface. Scientists have developed a range of methods to identify clouds and cloud shadows, based on their different spectral properties compared with the underlying landscape. Once clouds and cloud shadows are identified, these areas can be overlooked, and the rest of the satellite image can still be used. Effective, automated cloud-masking makes it possible to map and monitor changes in Earth’s surface over time, including landscape function, vegetation, ground cover, fire, and land use.
Technical details
This state-wide image was created by mosaicking 29,188 Sentinel-2 satellite-derived cloud masks for the year 2020, then calculating the percentage of days with cloud cover for each pixel. Sentinel-2 has a revisit rate of five days for any area across Queensland, resulting in this image being calculated as a percentage of days with clouds, rather than an exact number of days. Each pixel has been captured at roughly an average of 116 times over the year.
The cloud masks were produced by applying the Joint Remote Sensing Research Program’s Python Fmask—an object-based analysis to automatically detect cloud, cloud-shadow and snow in satellite images—to the Sentinel-2 imagery supplied by the European Space Agency. Fmask performs well, but not perfectly, with some false classifications in areas of water, highly reflective urban areas, or bright sands and clays. In the mosaic above, this is seen as the incongruous dark-blue spots in central and western Queensland.
A subtle striping effect is also visible throughout the state, which corresponds with the satellites’ scene boundaries. The five-day revisit rate of Sentinel-2 means that cloud cover may be detected more often in some scenes than in neighbouring scenes. Over a longer period, this quilted appearance becomes less obvious, as more images are captured.