2020–21 SLATS Report
Statewide overview
Key findings
- At the start of the 2020–21 SLATS monitoring period, Queensland had 95,677,148 hectares (ha) of woody vegetation with more than 10% crown cover.
- Approximately 7.6 million ha of this woody vegetation is existing regrowth. The remainder is remnant or high-value regrowth woody vegetation.
- In 2020–21, 349,399ha of woody vegetation was affected by clearing activity. This is a 17% decrease in clearing activity from 2019–20 (418,656ha) and a 49% decrease from 2018-19 (680,688ha).
- Of the total clearing activity, 322,515ha (92% of all clearing activity) resulted in full removal of the woody vegetation (i.e. ‘full clearing’). This is a 5% decrease in full clearing from 2019–20. The remaining 26,884ha of clearing activity in 2020–21 was partial clearing.
- In 2020–21, 59,654ha of new regrowth was mapped. It is important to note that most of the state’s existing regrowth is already included in the SLATS woody extent baseline. New regrowth is only mapped if it can be reliably detected using SLATS methods.
- At the end of the 2020–21 SLATS monitoring period, Queensland had 95,414,287ha of woody vegetation. From a starting balance of 95,677,148ha, 322,515ha was subtracted for full clearing and 59,654ha was added for new regrowth. This represents a net reduction of 262,861ha in the extent of the state’s woody vegetation from 2019–20.
Clearing activity in Queensland in 2020–21
In 2020–21, a total of 349,399ha of woody vegetation was affected by clearing activity in Queensland—this includes full and partial clearing. This is a 17% decrease in clearing activity from 2019–20 (418,656ha) and a 49% decrease from 2018–19 (680,688ha). Of the total clearing activity undertaken in 2020–21, 322,515ha (92% of all clearing activity) resulted in full removal of the woody vegetation (i.e. full clearing). The remaining 26,884ha of clearing activity was partial clearing.
Clearing activity 2018–19 to 2020–21
Area of clearing activity from 2018–19 to 2020–21.
- Full clearing refers to areas which have been converted from woody to non-woody (i.e. less than 10% crown cover remains).
- Partial (major) are clearing areas where the woody vegetation has been significantly modified but remains woody (i.e. greater than 10% crown cover remains but more than 50% of the area has been affected by the clearing).
- Partial (minor) are clearing areas where some modification of the woody vegetation has occurred, remaining woody (i.e. greater than 10% crown cover remains but less than 50% of the area has been affected by the clearing).
Spatial distribution of clearing activity 2020–21
Regrowth in Queensland in 2020–21
At the start of the 2020–21 monitoring period, approximately 7.6 million ha of the state’s woody vegetation was not mapped as remnant or high-value regrowth vegetation and is therefore assumed to be existing regrowth woody vegetation.
In the 2020–21 monitoring period, 59,654ha of new regrowth was mapped. These are areas that were not previously mapped in the 2018 woody vegetation extent baseline or in the 2019–20 monitoring period and are only now considered to have sufficient woody vegetation cover to be added to the woody extent. Given most of the existing regrowth was captured in the 2018 baseline, high levels of new regrowth would not be expected in the first few years to follow. This is due to the generally longer timeframes it takes for new regrowth to become sufficiently woody to enable reliable identification and mapping.
Regrowth 2019–20 and 2020–21
Area of new regrowth in 2019–20 and 2020–21.
- Regrowth are new woody vegetation areas which have regrown sufficiently to be added to the SLATS woody extent. Regrowth was not reported in 2018-19.
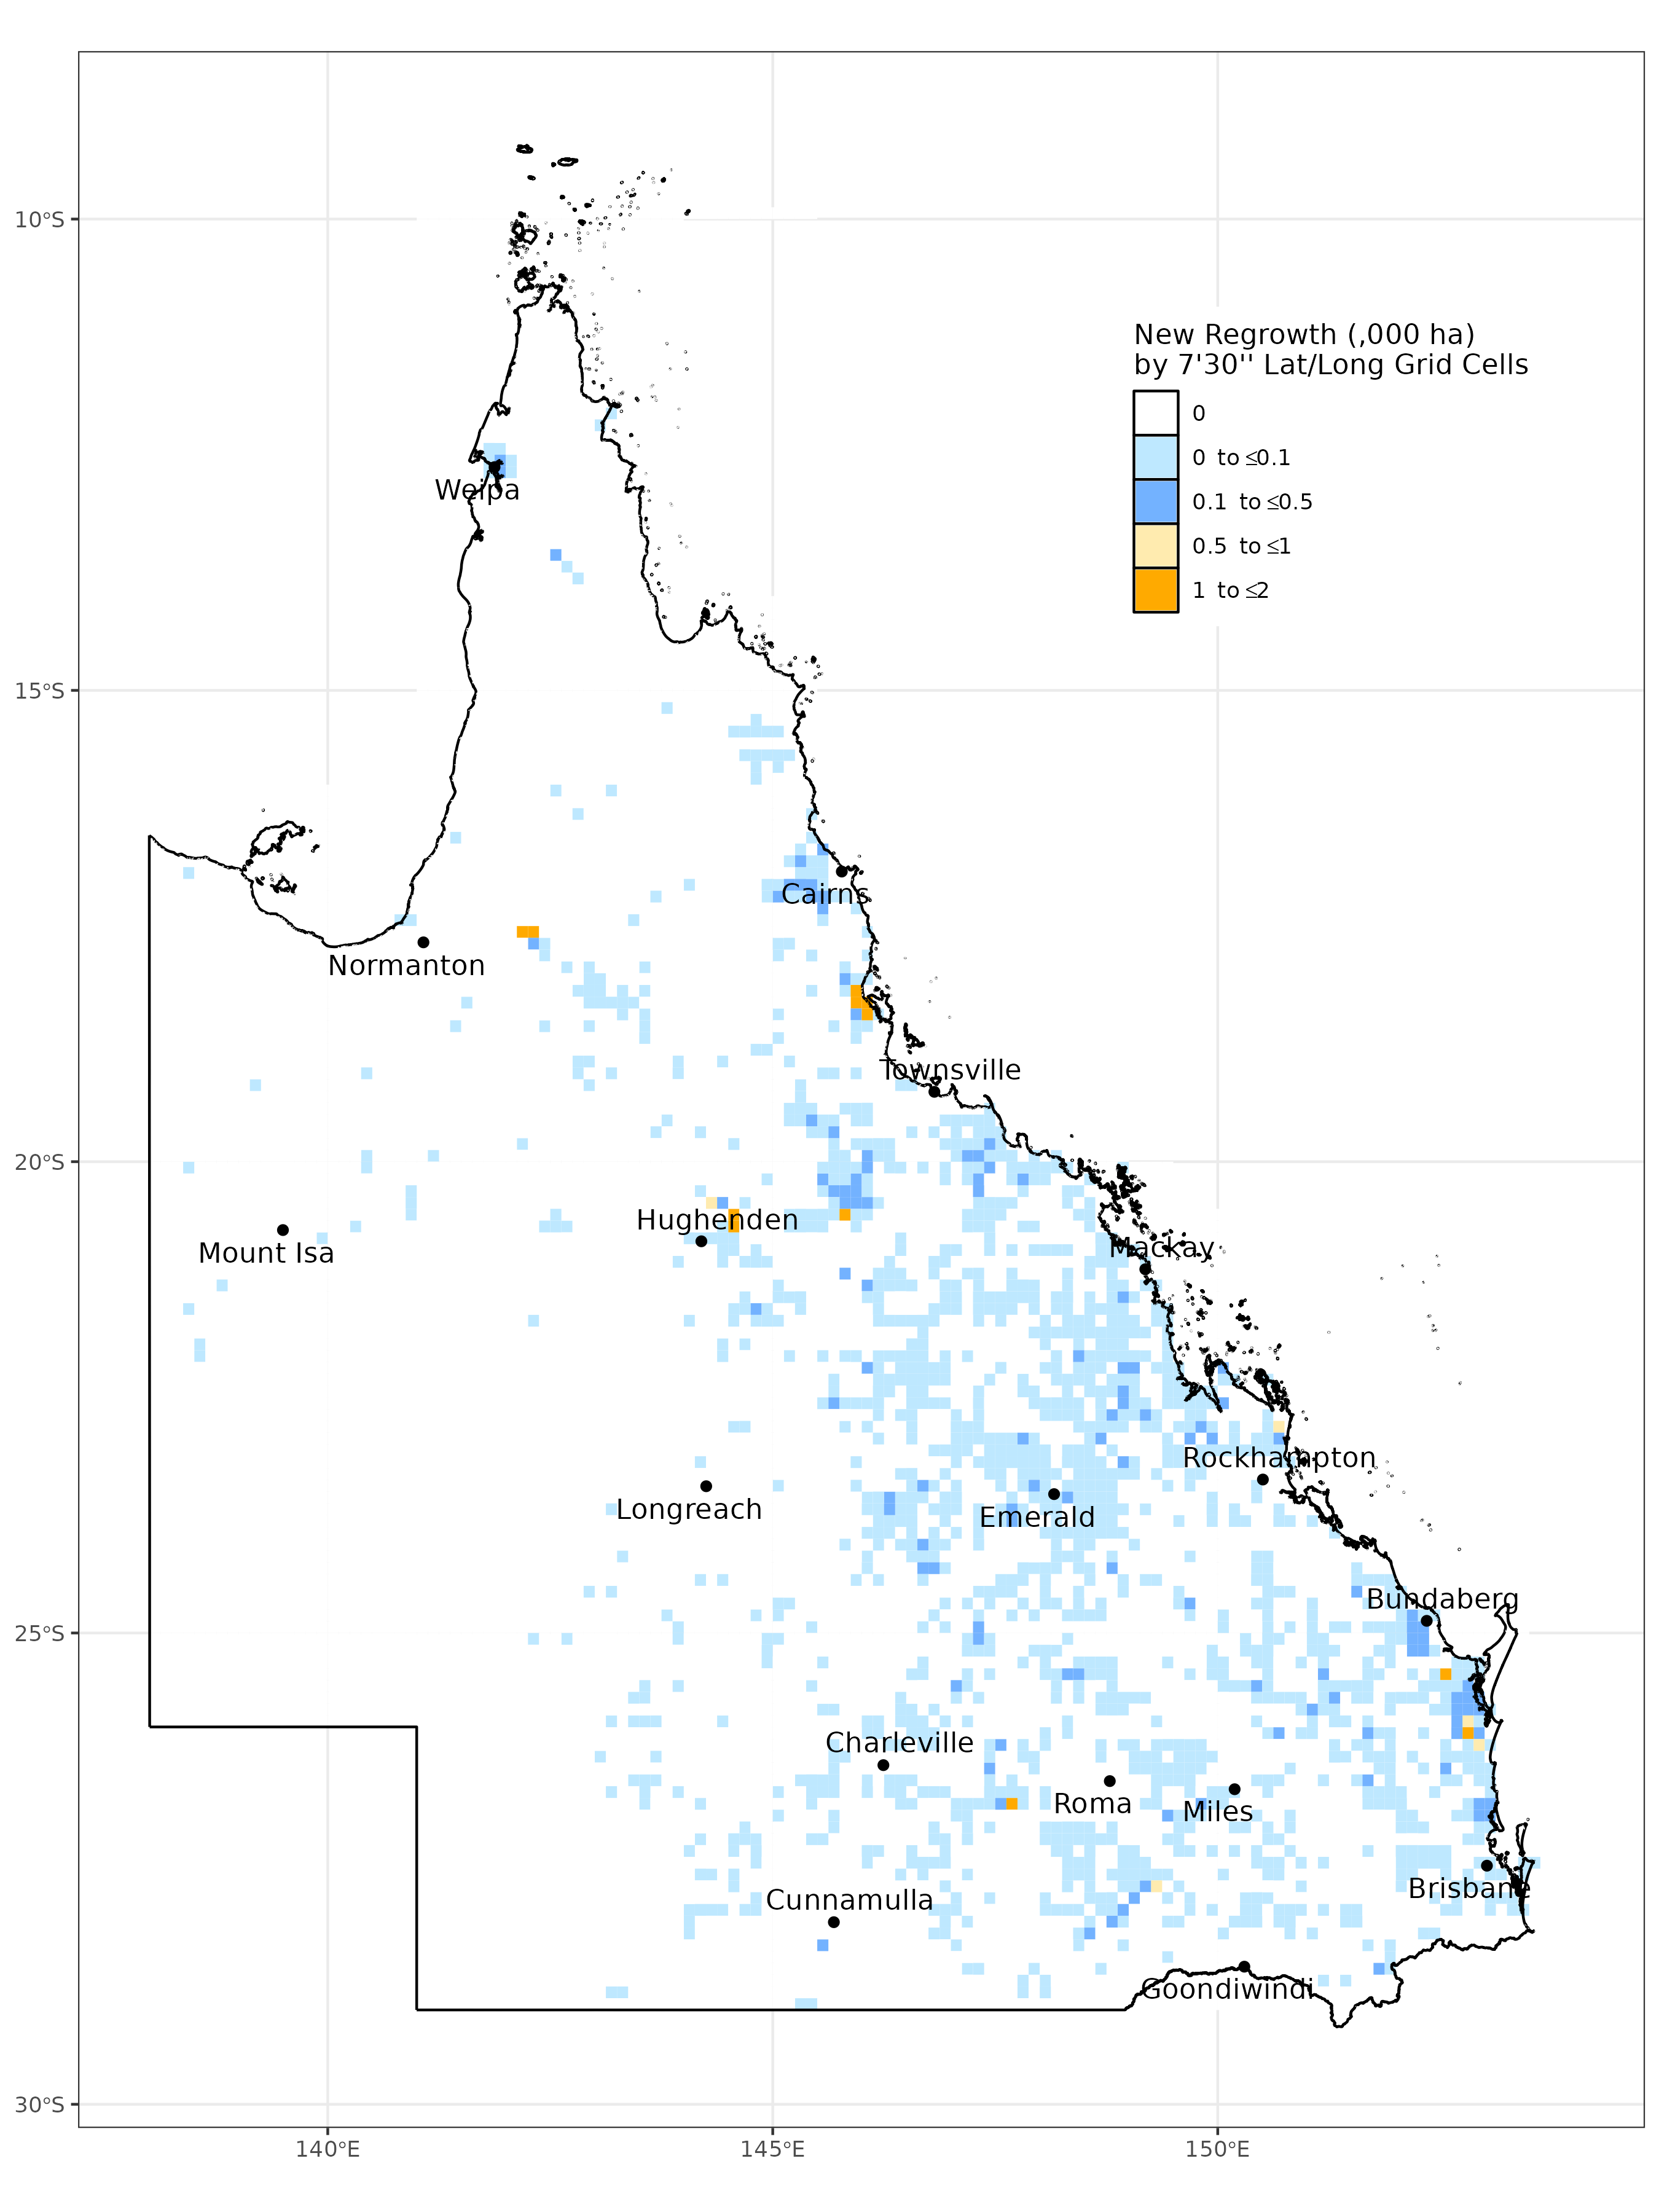
Spatial distribution of regrowth 2020–2021
Woody vegetation extent change in Queensland in 2020–21
At the end of the 2020–21 SLATS monitoring period, Queensland had 95,414,287ha of woody vegetation. From a starting balance of 95,677,148ha, 322,515ha was subtracted for full clearing and 59,654ha was added for new regrowth. This represents a net reduction of 262,861ha in the extent of the state’s woody vegetation from 2019–20.
Transaction summary 2020–21
| Category | Gain (ha) | Loss (ha) | Balance (ha) |
|---|---|---|---|
| Opening balance August 2020 | - | - | 95,679,990 |
| Adjustment | 10,245 | -13,088 | 95,677,148 |
| Crop | 4,041 | -5,156 | 95,676,033 |
| Forestry | 14,531 | -11,312 | 95,679,252 |
| Infrastructure | 86 | -2,243 | 95,677,095 |
| Mine | 1,117 | -4,736 | 95,673,476 |
| Pasture | 39,837 | -297,881 | 95,415,432 |
| Settlement | 42 | -1,187 | 95,414,284 |
| Closing balance August 2021 | - | - | 95,414,287 |
This transaction summary shows the opening balance of woody vegetation at the start of the 2020–21 monitoring period, the losses due to clearing activity that resulted in the full removal of the woody vegetation, and the gains due to new regrowth, for each landcover replacement class. Loss and gain adjustments were made to correct for areas in the woody extent that were identified as previous errors during the SLATS mapping processes. A closing balance at the end of the 2020–21 monitoring period is provided.
While these figures represent a net reduction in woody vegetation extent, it is important to acknowledge that not all vegetation change is equal. For example, clearing in remnant areas cannot be directly compared with clearing in non-remnant areas in terms of the impacts on biodiversity, carbon or landscape function. Similarly, new regrowth does not offset remnant loss for the same reasons.