2018–19 SLATS Report
Key findings
- In 2018–19, 680,688 hectares (ha) of woody vegetation were affected by clearing activity in Queensland. This represents about 0.7% of the state’s woody vegetation.
- Of the total clearing activity in 2018–19, 559,844ha (82% of all clearing activity) resulted in full removal of the woody vegetation. The remainder was partially cleared.
- At the start of the 2018–19 SLATS monitoring period, Queensland had 96,575,925ha of woody vegetation. With 559,844ha of woody vegetation converted to non-woody through full removal of the woody vegetation, there was a balance of 96,016,081ha of woody vegetation at the end of the monitoring period.
- Clearing activity in Category X areas (i.e. areas not generally regulated by the Vegetation Management Act 1999) accounted for about 70% or 477,390ha of the total area. About 28% or 189,735ha was in Category B (remnant) areas with the remainder mostly in Category C (high value regrowth vegetation) (1.5% or 10,522ha) and Category R (regrowth watercourse area) (<1% or 2,968ha) areas.
- About 26% of the clearing activity was in areas that contained least concern regional ecosystems and about 3% was in areas identified as of concern regional ecosystems. Less than 1% of the clearing was in areas with endangered regional ecosystems.
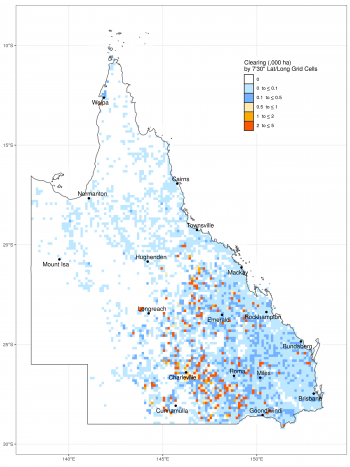
- Of the state’s 13 bioregions, the Brigalow Belt (43% or 290,952ha) and Mulga Lands (42% or 284,648ha) had the majority (85%) of clearing activity. About 8% of clearing in the Brigalow Belt and 31% of clearing in the Mulga Lands resulted in partial removal of the woody vegetation.
- About 93% (633,336ha) of the clearing activity in the state was attributed to the pasture landcover replacement class.
- About 88% of the total clearing activity was in sparse and very sparse woody vegetation, i.e. vegetation with less than 50% crown cover.
- Based on preliminary estimates of woody vegetation age, about 84% of the total clearing activity was in vegetation greater than 15 years old (refer to note).
On this page
Overview—Mapping and monitoring woody vegetation ecosystems
With an area of approximately 173 million hectares, Queensland is the second largest state in Australia. It is nearly five times the size of Japan and seven times the size of Great Britain. It is home to diverse flora and fauna due to its unique habitats, which include extensive arid and semi-arid rangelands and temperate, sub-tropical and tropical environments.
Queensland has more than 1400 regional ecosystems with the majority of these described as woody regional ecosystems. These woody regional ecosystems include the sparse and very sparse shrublands and woodlands of the extensive arid and semi-arid rangelands and the sparse woodlands and mid-dense and dense forests and rainforests along the Great Dividing Range, the coastal plains and in the Cape York Peninsula and Wet Tropics bioregions. These ecosystems play a critical role in supporting biodiversity, maintaining landscape function and water quality, supporting agricultural production, sequestering and storing atmospheric carbon dioxide, and providing recreation and natural amenity. To conserve, protect, and sustainably use these ecosystems in a changing climate, it is essential to have spatial and temporal data and information to characterise their composition and structure and to monitor their dynamics.
In Queensland, the regional ecosystems framework provides the basis for describing the vegetation types and their remnant status. The Statewide Landcover and Trees Study (SLATS) monitors woody vegetation extent, clearing and regrowth using Sentinel-2 satellite imagery as its primary monitoring tool. A Spatial BioCondition framework has also been developed to characterise and map the condition of the state’s regional ecosystems. Combined, these initiatives provide a spatially- and temporally-comprehensive account of Queensland’s ecosystems based on peer-reviewed science.
About this report
This report is the first change report for a new series of SLATS reporting which monitors and accounts for woody vegetation extent and change in Queensland, annually. The revised and enhanced methodology now monitors and reports change in woody vegetation extent against a 2018 woody vegetation extent baseline. Additional scientific approaches to identify the type of clearing activity and provide estimates of woody vegetation density and age have also been developed to better describe what woody vegetation currently exists, where and how it is being cleared, and where it is regrowing.
This SLATS report is for the 2018–19 monitoring period. This is nominally from August 2018 to August 2019. It only reports on clearing for this monitoring period—regrowth reporting is not included. It is assumed that existing regrowth in 2018–19 has been mapped and characterised in the 2018 woody vegetation extent baseline. As regrowth generally occurs on time scales greater than one year, mapping of new regrowth will be included in the 2019–20 SLATS reporting, and annual reporting thereafter.
Regional summary data for bioregions are also presented. It is important to note that clearing in remnant and non-remnant areas, as mapped by the regional ecosystems, is not reported here. This is because clearing in remnant vegetation does not always result in a conversion to non-remnant vegetation. For data and information on change in remnant vegetation, visit Remnant regional ecosystem vegetation in Queensland.
Data and information
Additional reporting in this series includes the 2018 woody vegetation extent baseline report for the state. To access SLATS data and data summaries visit SLATS data.
2018–19 woody vegetation clearing in Queensland
At the beginning of the 2018–19 SLATS monitoring period, SLATS reporting estimated that Queensland had 96,575,925ha of woody vegetation. In the 2018–19 monitoring period, 680,688ha of that area was mapped as being affected by human-induced clearing activity. Of this, 82% or 559,844ha of the clearing activity resulted in full removal of the woody vegetation, leaving a balance of 96,016,081ha of woody vegetation at the end of the monitoring period.
More than two-thirds (477,395ha or 70%) of the total clearing activity occurred in Category X areas (as identified in the Regulated Vegetation Management Map). The Brigalow Belt (249,443ha) and the Mulga Lands (150,780ha) bioregions accounted for 84% of this Category X clearing activity. A further 28% (189,735ha) was in Category B (remnant) areas with 69% (130,429ha) of that occurring in the Mulga Lands bioregion. The relatively small remaining clearing activity was mostly in Category C (high value regrowth vegetation) (1.5% or 10,522ha) and Category R (regrowth watercourse area) (<1% or 2,968ha) areas. Of the clearing in Category B areas, 51% (96,539ha) was mapped as partially cleared, with most of this partial clearing activity also occurring in the Mulga Lands bioregion (78,863ha).
Approximately 71% of the clearing activity was in areas with no vegetation management status. About 26% of the clearing activity was in areas that contained least concern regional ecosystems and about 3% was in of concern regional ecosystems. Less than 1% of the clearing activity was in endangered regional ecosystems.
Of the state’s 13 bioregions, the Brigalow Belt (43% or 290,952ha) and the Mulga Lands (42% or 284,648ha) had the majority (85%) of the clearing activity in 2018–19. About 8% of the clearing in the Brigalow Belt resulted in partial removal of the woody vegetation. In the Mulga Lands, 31% of the clearing resulted in partial removal of the woody vegetation. Clearing practices in the Mulga Lands often result in strips or patches of woody vegetation being removed, as the land managers manage the mulga shrublands (Acacia aneura) for fodder for stock, particularly in drought conditions. All local government areas in the Mulga Lands remained fully drought-declared during the 2018–19 SLATS monitoring period.
Clearing activity in the Great Barrier Reef catchment areas accounted for 32% (217,419ha) of the state’s total clearing in 2018–19. About 85% (185,243ha) of the clearing in reef catchments was in Category X areas and 11% (24,385ha) was in Category B areas. The majority (92%) of the clearing in reef catchments resulted in the full removal of the woody vegetation.
The pasture landcover replacement class accounted for 93% or 633,336ha of the clearing activity mapped in the 2018–19 monitoring period. The pasture landcover replacement class includes grazing areas and other general land management such as clearing for fence lines, property tracks and fire breaks. The forestry landcover replacement class accounted for 12,480ha of clearing activity and 6,979ha were attributed to the crop landcover replacement class. Combined, infrastructure, mine and settlement classes had 9,099ha of clearing activity.
Based on preliminary estimates of woody vegetation age (refer to note) and estimates of woody vegetation density derived from satellite imagery, about 74% of the clearing activity mapped in 2018–19 was sparse and very sparse woody vegetation that was greater than 15 years of age. Overall, 88% of clearing activity was sparse and very sparse woody vegetation with 84% of that estimated to be greater than 15 years of age.
Woody vegetation clearing in Queensland in 2018–19
Area of clearing activity.
- Full clearing refers to areas which have been converted from woody to non-woody (i.e. less than 10% crown cover remains).
- Partial (major) are clearing areas where the woody vegetation has been significantly modified but remains woody (i.e. greater than 10% crown cover remains but more than 50% of the area has been affected by the clearing).
- Partial (minor) are clearing areas where some modification of the woody vegetation has occurred, remaining woody (i.e. greater than 10% crown cover remains but less than 50% of the area has been affected by the clearing).

Transaction summary for woody vegetation extent in Queensland in 2018–19
This transaction summary shows the opening balance of woody vegetation at the start of the 2018–19 monitoring period, and the losses due to clearing activity, for each landcover replacement class, that resulted in the full removal of the woody vegetation. A closing balance at the end of the 2018–19 monitoring period due to the losses is provided. Future SLATS reports will include gains due to regrowth.
| Category | Gain (ha) | Loss (ha) | Balance (ha) |
|---|---|---|---|
| Opening balance, August 2018 | - | - | 96,575,925 |
| Pasture | - | -532,121 | 96,043,804 |
| Forestry | - | -11,644 | 96,032,160 |
| Crop | - | -6,979 | 96,025,181 |
| Mine | - | -6,389 | 96,018,792 |
| Infrastructure | - | -1,789 | 96,017,003 |
| Settlement | - | -922 | 96,016,081 |
| Closing balance, August 2019 | - | - | 96,016,081 |
Regulated vegetation management map of woody vegetation cleared in Queensland in 2018–19
Regulated vegetation management maps show the different vegetation categories that are present on a parcel of land. This information helps land managers determine the type of approval needed for vegetation clearing. The categories are as follows:
- Category A—vegetation that is subject to compliance notices, offsets and voluntary declarations
- Category B—remnant vegetation shown on a regional ecosystem or remnant map as an endangered regional ecosystem, an of concern regional ecosystem or a least concern regional ecosystem
- Category C—high-value regrowth vegetation
- Category R—regrowth watercourse area
- Category X—vegetation that is not generally regulated by the vegetation management laws.
For further information refer to General guide to the vegetation clearing codes.
Vegetation management status of woody vegetation cleared in Queensland in 2018–19
The vegetation management status refers to the current remnant extent of a regional ecosystem. The categories are Endangered, Of concern and Least concern.
For further information refer to General guide to the vegetation clearing codes.
Landcover replacement class of woody vegetation cleared in Queensland in 2018–19
The landcover replacement class is interpreted by Queensland Government Department of Environment and Science scientists as part of the SLATS mapping process. It provides an indication of the purpose for which the vegetation was cleared. Read more about SLATS methodology.
Density of woody vegetation cleared in Queensland in 2018–19
Clearing area for density classes of woody vegetation.
- Dense vegetation has a Foliage Projective Cover (FPC) of 70-100% (>80% crown cover)
- Mid-dense a FPC of 30-70% (50-80% crown cover)
- Sparse a FPC of 10-30% (20-50% crown cover)
- Very sparse/isolated a FPC of <10% (0.25-20% crown cover).
Age of woody vegetation cleared in Queensland in 2018–19
Clearing area for age classes of woody vegetation. Age estimates are preliminary and should be read as indicative only (refer to note).
Age and density of woody vegetation cleared in Queensland in 2018–19
Clearing area by density and age classes.
- Dense vegetation has a Foliage Projective Cover (FPC) of 70-100% (>80% crown cover)
- Mid-dense a FPC of 30-70% (50-80% crown cover)
- Sparse a FPC of 10-30% (20-50% crown cover)
- Very sparse/isolated a FPC of <10% (0.25-20% crown cover).
2018–19 woody vegetation clearing in Queensland by bioregion
Note: Age estimates should be read as indicative only. SLATS continues to work on refining its age estimation approaches. The current estimates are based largely on data relating to time since cleared derived from SLATS clearing histories, but also includes information derived from time-series analysis of Landsat satellite imagery aimed at detecting disturbance and woody vegetation regrowth. The age estimates use this information where sufficient evidence was available in the time series data. For more information on how the age estimates are derived refer to the SLATS methodology. It is also important to note that woody vegetation that is greater than 15 years is not always considered to be remnant or high value regrowth as additional criteria such as species composition and vegetation height are used to determine remnant or high value regrowth status. This is determined by the Queensland Herbarium as part of the regional ecosystem mapping framework.