2019–20 SLATS Report
Statewide overview
Key findings
- At the start of the 2019–20 SLATS monitoring period, Queensland had 95,978,402 hectares (ha) of woody vegetation with more than 10% crown cover.
- Approximately 8 million ha of this woody vegetation is existing regrowth. The remainder is remnant or high-value regrowth woody vegetation.
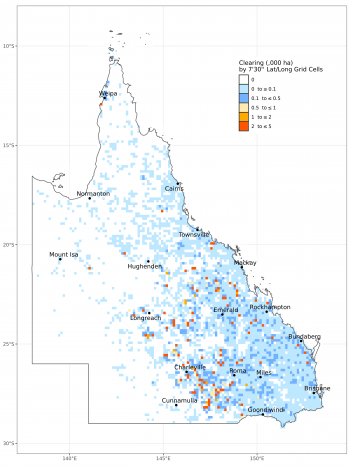
- In 2019–20, 418,656ha of woody vegetation was affected by clearing activity. This is a 38% decrease in clearing activity from 2018–19 (680,688ha).
- Of the total clearing activity undertaken in 2019–20, 339,144ha (81% of all clearing activity) resulted in full removal of the woody vegetation (i.e. ‘full clearing’). This is a 39% decrease in full clearing from 2018–19 (559,844ha). The remaining 79,512ha of clearing activity in 2019–20 was partial clearing.
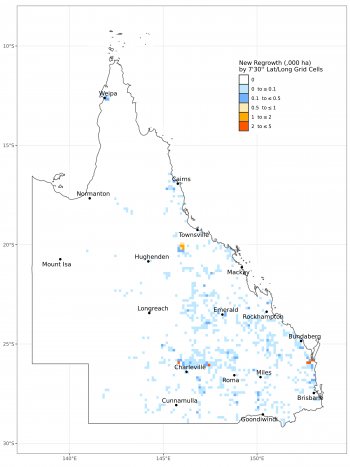
- In 2019–20, 42,575ha of new regrowth was mapped. This is the first monitoring period where new regrowth has been mapped and reported following changes to the SLATS methodology that commenced in 2018–19.
- With a starting balance of 95,978,402ha, and 339,144ha of full clearing (i.e. loss) and 42,575ha of new regrowth (i.e. gain), there was 95,681,833ha of woody vegetation in Queensland at the end of the 2019–20 SLATS monitoring period. This represents a net reduction of 296,569ha in the extent of the state’s woody vegetation.
At the start of the 2019–20 SLATS monitoring period, SLATS had mapped 96,016,011ha of woody vegetation with more than 10% crown cover. Following a loss adjustment of 43,289ha, and a gain adjustment of 5,680ha to correct for errors in the woody extent mapping identified through the 2019–20 mapping process, the revised woody extent at the start of the 2019–20 SLATS monitoring period was 95,978,402ha.
The errors identified are areas that were either misclassified as woody vegetation in the baseline mapping or were previously missed and have been identified in subsequent updates due to additional evidence being available from later image dates, field verification, or a longer time-series of satellite imagery. Refinements to the woody extent baseline will continue to be made where errors are identified to ensure the baseline is maintained to be as accurate as possible.
Clearing activity in Queensland in 2019–20
In 2019–20, a total of 418,656ha of woody vegetation were affected by all clearing activity in Queensland—this includes full and partial clearing. This is a 38% decrease in clearing activity from 2018–19 (680,688ha). Of the total clearing activity in 2019–20, 339,144ha (81% of all clearing activity) resulted in full removal of the woody vegetation (i.e. ‘full clearing’). This is a 39% decrease in full clearing from 2018–19 (559,844ha). The remaining 79,512ha of clearing activity in 2019–20 was mapped as partial clearing, a 34% decrease in partial clearing activity from 2018–19 (120,844ha).
Clearing activity 2018–19 and 2019–20
Area of clearing activity in 2018–19 and 2019–20.
- Full clearing refers to areas which have been converted from woody to non-woody (i.e. less than 10% crown cover remains).
- Partial (major) are clearing areas where the woody vegetation has been significantly modified but remains woody (i.e. greater than 10% crown cover remains but more than 50% of the area has been affected by the clearing).
- Partial (minor) are clearing areas where some modification of the woody vegetation has occurred, remaining woody (i.e. greater than 10% crown cover remains but less than 50% of the area has been affected by the clearing).
Spatial distribution of clearing activity 2019–20
Regrowth in Queensland in 2019–20
At the start of the 2019–20 monitoring period, approximately 8 million ha of the state’s woody vegetation was not mapped as remnant or high-value regrowth vegetation and is therefore assumed to be existing regrowth woody vegetation.
In the 2019–20 monitoring period, 42,575ha of new regrowth was mapped. These are areas of regrowing woody vegetation that were not previously mapped in the 2018 woody vegetation extent baseline and are now considered to have sufficient woody vegetation cover to be added to the woody extent. This is the first monitoring period where new regrowth has been mapped and reported following recent changes to the SLATS methodology. Given most of the existing regrowth was captured in the 2018 baseline, high levels of new regrowth would not be expected given the longer timeframes it takes for new regrowth to become sufficiently woody to enable reliable identification and mapping.
Regrowth 2018–19 and 2019–20
Area of new regrowth in 2018–19 and 2019–20.
- Regrowth are new woody vegetation areas which have regrown sufficiently to be reliably added to the SLATS woody extent. Regrowth was not reported in 2018-19.
Spatial distribution of regrowth 2019–20

Woody vegetation extent change in Queensland in 2019–20
With a revised starting balance of 95,978,402ha, and 339,144ha of full clearing (i.e. loss) and 42,575ha of new regrowth (i.e. gain), there was a balance of 95,681,833ha of woody vegetation in Queensland at the end of the 2019–20 SLATS monitoring period. This represents a net reduction of 296,569ha in the extent of the state’s woody vegetation.
Transaction summary 2019–20
| Category | Gain (ha) | Loss (ha) | Balance (ha) |
|---|---|---|---|
| Opening balance August 2019 | - | - | 96,016,011 |
| Adjustment | 5,680 | -43,289 | 95,978,402 |
| Pasture | 32,606 | -311,421 | 95,699,587 |
| Crop | 1,795 | -7,466 | 95,693,916 |
| Forestry | 7,118 | -10,390 | 95,690,644 |
| Mine | 1,046 | -6,699 | 95,684,991 |
| Settlement | 10 | -948 | 95,684,053 |
| Infrastructure | 1 | -2,221 | 95,681,833 |
| Closing balance August 2020 | - | - | 95,681,833 |
This transaction summary shows the opening balance of woody vegetation at the start of the 2019–20 monitoring period, the losses due to clearing activity that resulted in the full removal of the woody vegetation, and the gains due to new regrowth, for each landcover replacement class. Loss and gain adjustments are also made to correct for areas in the woody extent that were identified as previous errors during the SLATS mapping processes. A closing balance at the end of the 2019–20 monitoring period is given.
While these figures represent a net reduction in woody vegetation extent, it is important to acknowledge that not all change is equal. For example, clearing in remnant areas cannot be directly compared with clearing in non-remnant areas in terms of the impacts on biodiversity, carbon or landscape function. Likewise, new regrowth does not offset remnant loss for the same reasons.