Mapping methodology
Remote sensing scientists have developed an automated method to detect fire scars using the European Space Agency’s Sentinel-2 satellite imagery. This builds on previous work using Landsat satellite imagery, which mapped Queensland’s fire history between 1986 and 2016.
Current method
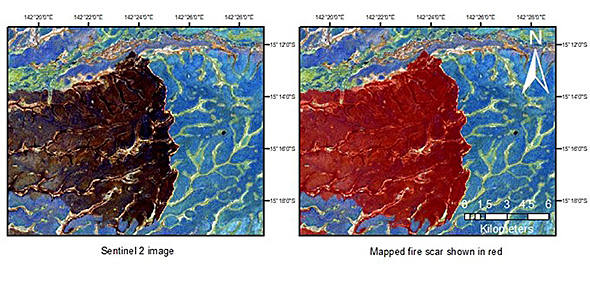
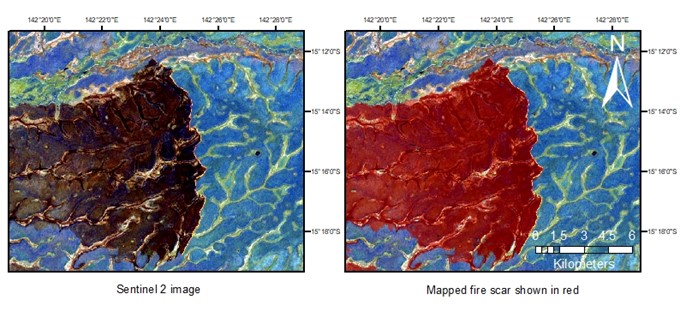
Queensland’s diverse landscapes make it challenging to automatically detect burned areas using satellite imagery, due to the wide spectral diversity caused by different types of vegetation, soil type, time elapsed between observations, the confounding effects of cloud and shadow, and fire severity. Our current method uses several steps to address these challenges, based on Hardtke et al (2015):
- Pre-processing the imagery to remove most of the effects of waterbodies, cloud, cloud shadow and terrain.
- Identifying pixels with a high likelihood of being burned (ie potential fire scars) by calculating the difference between two satellite images for the bare soil fraction of the fractional cover product and the normalized burned ratio (NBR) spectral index. This step aims to minimise the area falsely classified as burned (ie commission errors or ‘false positives’) by having strict thresholds.
- Expanding the potential burned area by analysing the pixels surrounding the fire scars identified in step 2, using a region-growing algorithm on the bare soil fraction. This step aims to minimise the extent of missed burned area (ie omission errors or ‘false negatives’) by having looser thresholds. These thresholds are region-specific across the diverse landscapes of Queensland.
- Removing non-burned areas that show similar changes to burned areas (such as cropping and cloud shadow) via decision tree analysis. This further reduces commission errors.
- Manual editing to remove any remaining misclassifications to ensure a more accurate final product.
This method produces a high quality statewide product each month at 10m resolution. Data products from 2017 onwards are available.
The Sentinel-2 fire scar mapping method has been validated using 480,000 independent observations selected from a range of environments and periods within the fire season across Queensland. Each observation was assigned with a label, either burned or not-burned, using Sentinel-2 imagery as reference. The validation result showed that a high proportion of burned area was correctly classified (f1score = 0.91) with low commission (13%) and omission (8%) errors. The omission error does not include burned area missed because of missing data (e.g. long periods without cloud-free images) due to the lack of an independent validation data set.
Older method (Landsat)
The Landsat-based fire scar mapping method involved 4 key stages (Goodwin and Collett, 2014):
- Pre-processing the imagery to remove cloud and cloud shadow affected areas
- Identifying areas of interest (ie potential fire scars) using the changes between two dates in the Shortwave Infrared and Near Infrared bands of Landsat imagery.
- Mapping the spatial extent of the detected fire scar using a region-growing algorithm.
- Conducting further manual analysis to remove misclassified fire scars and residual artifacts.
Statewide annual products at 30m resolution are available for 1986-2016.
Related publication
Goodwin, N. R., & Collett, L. J. (2014). Development of an automated method for mapping fire history captured in Landsat TM and ETM+ time series across Queensland, Australia. Remote Sensing of Environment, 148, 206–221.
Hardtke, L.A., Blanco, P.D., del Valle, H.F., Metternicht, G.I & Sione, W.F (2015) Semi-automated mapping of burned areas in semi-arid ecosystems using MODIS time-series imagery. International Journal of Applied Earth Observation and Geoinformation, 38, 25-35.