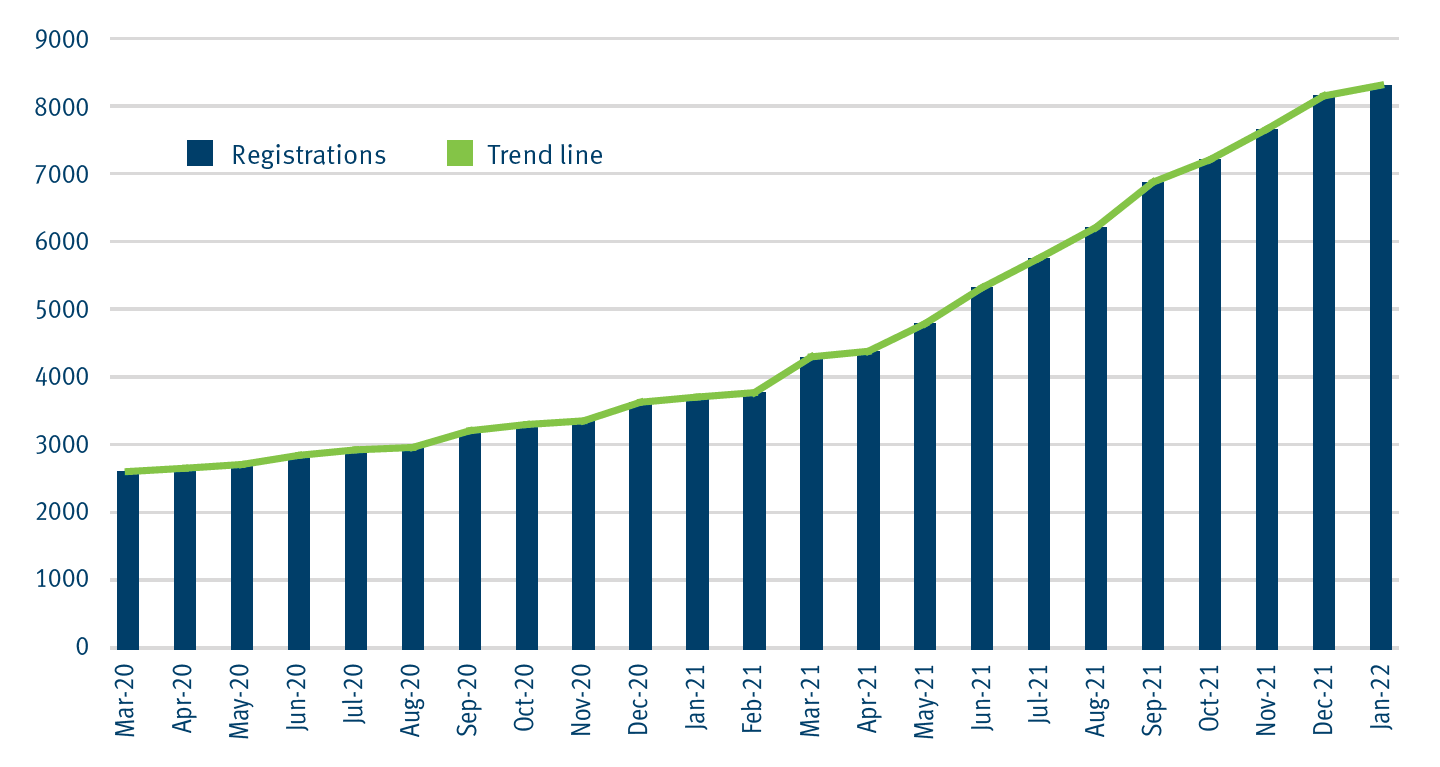
Battery electric vehicles registered in Queensland
As at 31 January 2022.
Registered battery electric vehicles include passenger cars, light vans, motorcycles, buses and trucks. Registration data includes private ownership, commercial fleet, and commercial dealership registrations.
Legend: Registrations Trend line
This graph shows the number of battery electric vehicles registered in Queensland from March 2020 to January 2022.
Month
Number of battery electric vehicles registered
March 2020
2,588
April 2020
2,636
May 2020
2,691
June 2020
2,824
July 2020
2,904
August 2020
2,939
September 2020
3,182
October 2020
3,273
November 2020
3,326
December 2020
3,597
January 2021
3,673
February 2021
3,737
March 2021
4,258
April 2021
4,339
May 2021
4,743
June 2021
5,266
July 2021
5,695
August 2021
6,143
September 2021
6,801
October 2021
7,129
November 2021
7,574
December 2021
8,057
January 2022
8,213
Suburbs with most Battery Electric Vehicles (BEVs) registered (passenger cars)
Suburb
Number of BEVs (passenger cars)
Southport
127
Brisbane City
122
Surfers Paradise
90
Hope Island
81
Fortitude Valley
77
All others
6686
Total passenger BEVs
7183
Total BEVs
8213
EV fleet penetration: 0.18%
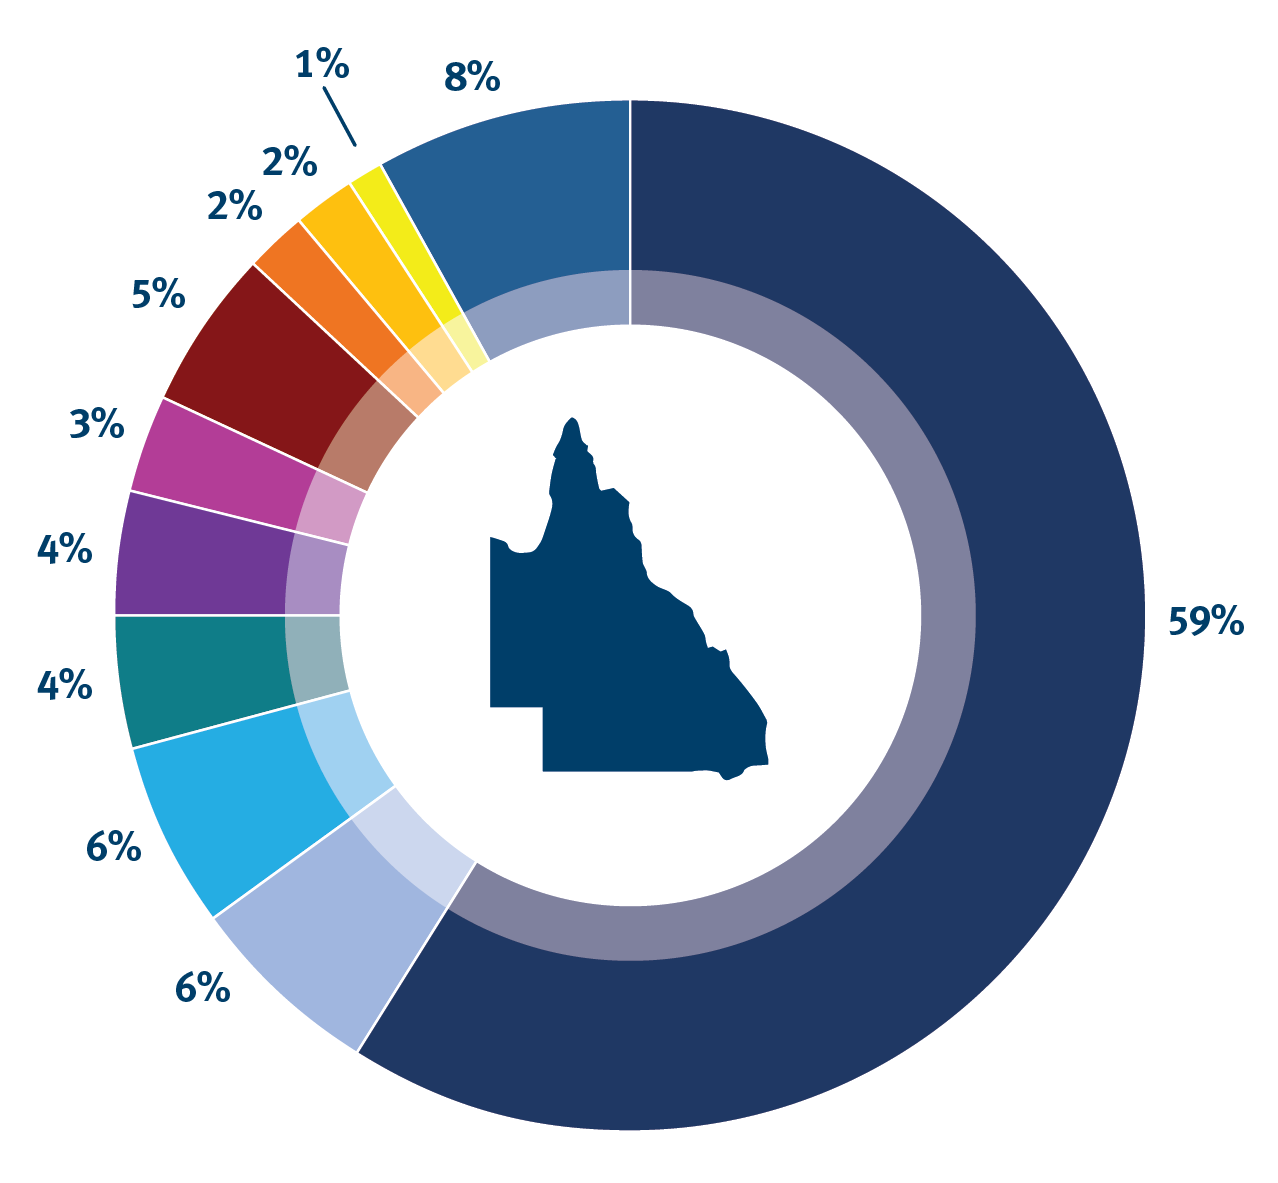
Battery models registered in Queensland (passenger cars)
Legend: Tesla 3 Tesla S Nissan Leaf Tesla X Hyundai Kona Hyundai Ioniq MG ZS EV Mercedes EQ C400 Mercedes EQA 250 Cooper SE All others
This graph shows the percentage of battery electric vehicle models (passenger vehicles) registered in Queensland as of 31 January 2022.
Model
% Registered*
Tesla 3
59%
Tesla S
6%
Nissan Leaf
6%
Tesla X
5%
Hyundai Kona
4%
Hyundai Ioniq
3%
MG ZS EV
5%
Mercedes EQ C400
2%
Mercedes EQA 250
2%
Cooper SE
1%
All others
8%
* Please note: these values are rounded to whole numbers and may not total to 100%.
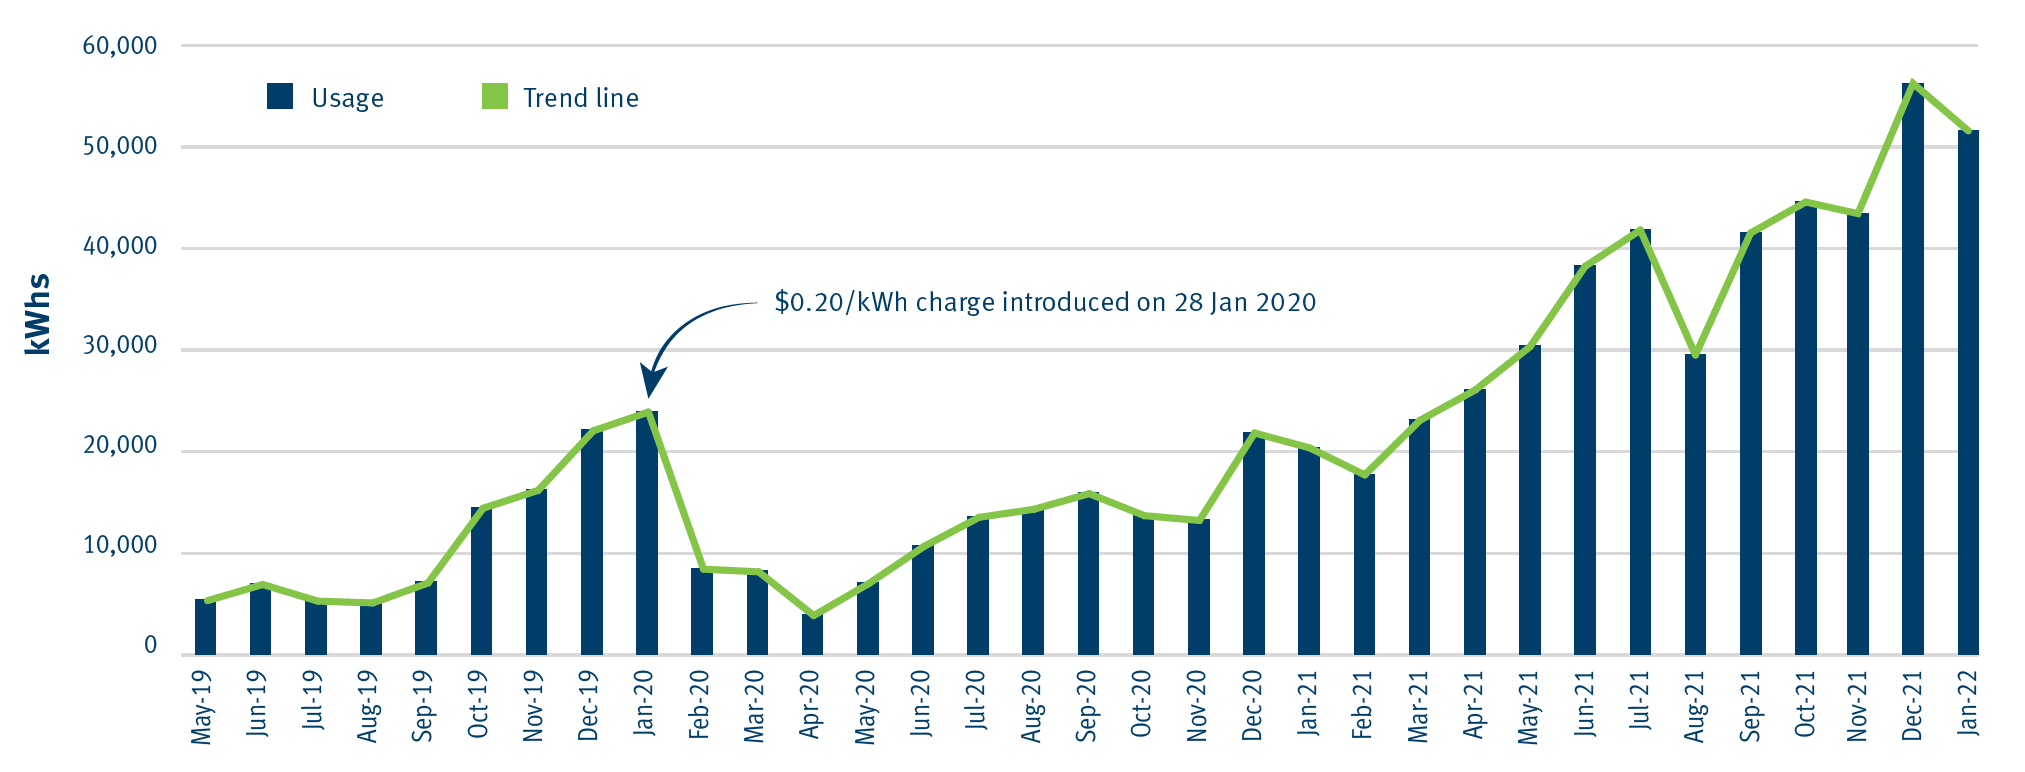
Queensland Electric Super Highway
Yurika own and operate all fast charging stations along the Queensland Electric Super Highway.
Usage
Legend: Usage Trend line
This graph shows the number of kilowatt-hours used along the Queensland Electric Super Highway from May 2019 to January 2022.
A $0.20/kWh charge was introduced on 28 January 2020.
Month
kWhs
May 2019
5,437.89
June 2019
7,018.79
July 2019
5,388.92
August 2019
5,210.10
September 2019
7,163.24
October 2019
14,501.00
November 2019
16,256.40
December 2019
22,102.89
January 2020
23,941.00
February 2020
8,523.82
March 2020
8,263.00
April 2020
3,970.00
May 2020
7,112.78
June 2020
10,754.05
July 2020
13,609.00
August 2020
14,407.00
September 2020
15,935.00
October 2020
13,774.00
November 2020
13,302.00
December 2020
21,888.00
January 2021
20,422.00
February 2021
17,774.00
March 2021
23,134.00
April 2021
26,093.00
May 2021
30,365.00
June 2021
38,250.00
July 2021
41,805.00
August 2021
29,543.60
September 2021
41,512.26
October 2021
44,556.70
November 2021
43,358.73
December 2021
56,503.75
January 2022
52,277.27
Popular fast-charging stations
Suburb
kWh Usage
%*
Hamilton
110,150.43
15%
Helensvale
52,741.04
7%
Coolangatta
48,002.98
6%
Cairns
44,845.92
6%
North Lakes
43,025.48
6%
All others
459,854.16
61%
Total kWh usage
763,342.00
* Please note: these values are rounded to whole numbers and may not total to 100%.
Tailpipe emissions saved
904–1,060 tonnes saved by using Green Energy—equivalent to removing 301 cars off Queensland roads.
Kilometres charged
4,126,267km charged, equivalent to driving around Australia 285 times. Based on an estimated distance of 14,500km to drive around Australia and 1kWh equating to 5–6km travelled.