Historical flood maps
Our collection of scanned historical flood maps of Queensland is available for free.
These flood and inundation maps are at various scales dating from 1893–1974. They show flood levels and probable inundation areas at various flood heights. A number of the map series include key maps.
Note: Those still in copyright are made available via Creative Commons CC BY licence, which means that you can view, print etc. without any restrictions.
How to access historical flood maps
- Access the collection of historical flood maps.
- Click on the resource series you want to view. This provides a summary of the map series chosen, with options to download or view the details in the file.
- Select either the Download or the Visualisation preview options to view the file which contains the details of the maps scanned for the resource series. For large series (e.g. the 10,000 series), it is easier to use the Download option.
Download option
- Click on Download.
- Open the csv file.
- The fields displayed (e.g. title) can be expanded to view the details.
- Click on the https link in the jpg_linkage column (Column G). Copy this URL and paste it into your browser. The first item is usually the key map (indicated by blue arrow). The actual maps are indicated by the red arrow.
- Press enter and the map opens.
- You can then save the map to a location of your choosing or crop parts and paste into documents etc.
![]()
Figure 1: Viewing options – choose Download.
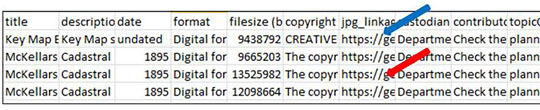
Figure 2: Example of download view.
Visualisation preview option
- Click on Visualisation preview.
- The fields displayed (e.g. title) can be expanded to view the details.
- Click on the https link in the jpg_linkage column to open your map. The first item is usually the key map (indicated by blue arrow). The actual maps are indicated by the red arrow.
- You can then save the map to a location of your choosing or crop parts and paste into documents etc.
![]()
Figure 3: Viewing options – choose Visualisation preview.
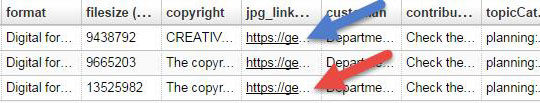
Figure 4: Example of visualisation preview.
Resource series titles
| Map series | Key map Link |
|---|---|
| Various scales flood series 1893—Brisbane | Not available |
| 6 chain flood series 1898—Brisbane | Not available |
| 20 chain inundation map 1933—Brisbane | Not available |
| 12-mile flood map 1949—Cooper creek | Not available |
| 10000 inundation series 1974-Brisbane Ipswich | Key map |
| Various scales flood SF series 1974-South East Queensland Bremer River flood maps Sf16 Sf19 Sf21 | Key map |
| Various scales flood SF series 1974-South East Queensland Bremer River flood maps Sf14 Sf15 Sf17 Sf18 Sf20 Sf22 | Key map |
| Various scales flood SF series 1974-South East Queensland Coomera and Nerang Rivers flood maps Sf10 Sf11 Sf12 Sf13 | Key map |
| Various scales flood SF series 1974-South East Queensland Logan and Coomera Rivers flood maps Sf2 to sf10 | Key map |
Related links
- Read about researching historical maps and plans.
- Learn about Queensland parishes and historical land administration.