Ground cover mapping methodology
How do we map ground cover?
We monitor ground cover by analysing thousands of satellite images using a high-performance computing facility.
Remote Sensing Scientists follow the process below:
- Download Landsat imagery from the United States Geological Survey and Sentinel-2 imagery from the Copernicus Australasia Regional Data Hub, a data hub that supports the European Commission’s Copernicus program.
- Pre-process imagery to correct for atmospheric and landscape effects and remove cloud contamination. This results in standardised surface reflectance images that enable comparison in space and time.
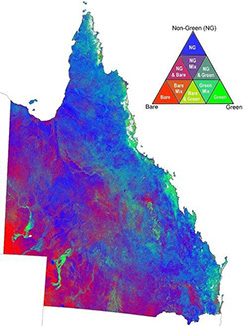
- Apply a fractional cover algorithm to calculate the percentage of green cover, non-green cover and bare ground for each pixel. The current algorithm is calibrated using over 4000 field sites collected by a number of contributors across Australia following a national field standard.
- Apply time-series analyses to fractional cover to estimate the persistent green component, which is assumed to represent the persistent woody cover. Estimate ground cover by applying an adjustment to fractional cover to account for the woody cover component.
- Derive a suite of spatial and temporal data products which are useful for understanding ground cover and ground cover dynamics.
- Deliver data and information via a range of mechanisms to landholders, extension officers, industry and government for a range of applications and purposes.
Ground cover datasets are available as either individual date products or as monthly or seasonal composites. Individual date imagery is the data that is captured each time the satellite passes over. This is useful for obtaining current information on ground cover or understanding cover levels at a particular point in time. For example, imagery from individual dates can help assess a short-term management action or the ground cover response to a rainfall event. However, this imagery may have areas of missing data, due to clouds or shadow.
The composites provide a median value over a period of either one month (monthly) or three months (seasonal). They are made by selecting the pixels from the individual date imagery which best represent the range of measurements throughout the period. These composites are very useful for analysing and monitoring trends over time, and have less missing data than the individual date products.

What products are available?
Three main products are available through the ground cover analysis process. Data is freely available through a variety of online tools and data sources.
Fractional cover
Remote Sensing Scientists measure land cover as percentages of green vegetation cover, non-green vegetation cover (litter, dead vegetation, branches) and bare ground (soil and rock). Scientists produce fractional cover images by applying the fractional cover algorithm to satellite imagery. However, fractional cover images provide a measure of total vegetation cover – they do not distinguish between over-storey ‘green’ vegetation (i.e. trees and shrubs) and ground layer ‘green’ vegetation (i.e. grasses, herbs, forbs). Fractional cover is produced using Landsat imagery from about 1990 to present, and the higher spatial and temporal resolution Sentinel-2 imagery from about 2016 to present.
Persistent green
The green cover fraction from the fractional cover product can be used to map persistent green cover in the landscape. This persistent green cover often represents woody vegetation. While grass and herbaceous vegetation show seasonal effects such as becoming green in response to rainfall and then drying out, woody vegetation tend to stay green over a longer period of time. Because of this, the persistent green fraction can be separated from ground cover through an algorithm comparing patterns of variation over time. The persistent green product is helping to understand woody vegetation trends and processes such as encroachment and thickening. These processes can affect the grazing potential of land, influence management actions, and have impacts on water quality.
Ground cover (cover under trees)
Scientists make a ground cover product without over-storey and mid-storey vegetation by removing the persistent green component from the fractional cover product. The approach is calibrated using the national field data set. The data derived from this method is called fractional ground cover or simply ground cover. The method is being applied operationally for single-date, monthly and seasonal imagery.

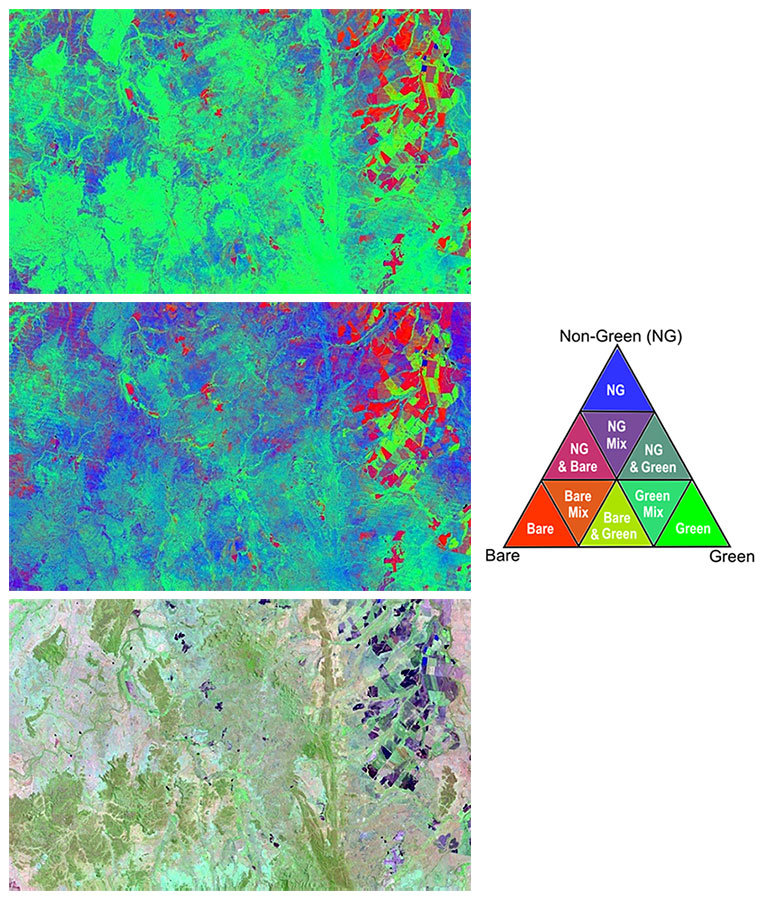
Credit: The image was supplied by the U.S. Geological Survey and processed by the Queensland Government’s Remote Sensing Sciences team.
Caption: An example of a seasonal fractional cover image and seasonal fractional ground cover image (cover under trees) for Autumn 2015. The top image shows the fractional cover (total vegetation cover), and the middle image shows ground cover only, i.e. without the over-storey vegetation. The middle image looks less green overall compared with the top image, due to the removal of the ‘persistent green’ component. Other patterns are also clearly visible. For example, vigorously growing crops at the right of the image are shown in green, and bare/fallow crops are shown in red. The bottom image shows the source Landsat 8 imagery over the area, for reference. (view larger image).
Related Publications
Scarth, P., Byrne, M., Danaher, T., Henry, B., Hassett, R., Carter, J. and Timmers, P. (2006). `State of the paddock: monitoring condition and trend in groundcover across Queensland’ in Proceedings of the 13th Australasian Remote Sensing and Photogrammetry Conference, Canberra, Australia, November 2006.
Scarth, P., Roder, A. and Schmidt, M. (2010). ‘Tracking grazing pressure and climate interaction – the role of Landsat fractional cover in time series analysis’ in Proceedings of the 15th Australasian Remote Sensing and Photogrammetry Conference, Alice Springs, Australia, September 2010.
Tindall, D., Trevithick, R., Scarth, P., Collett, L., Goodwin, N., Denham, R. and Flood, N. (2014). ‘Ground cover and fire in the grazing lands: RP64G Synthesis Report’, Department of Science, Information Technology, Innovation and the Arts. Brisbane.
Contact us
For more information about accessing ground cover products, contact our Principal Scientist via email at deanna.vandenberg@des.qld.gov.au