Spatial BioCondition
On this page
Spatial BioCondition explained
Spatial BioCondition (SBC) is a modelling framework that is used to predict and map the condition of vegetation in most of Queensland’s regional ecosystems.
Using machine learning to integrate site-based vegetation condition assessment methods and remote sensing land cover data, the framework predicts how well the vegetation maintains the biodiversity values in each ecosystem.
The SBC framework aligns with Queensland’s Regional Ecosystem (RE) and BioCondition frameworks.
SBC is a collaboration between the Department of Environment, Science and Innovation’s Queensland Herbarium and Biodiversity Sciences and Remote Sensing Sciences teams and the Joint Remote Sensing Research Program.
SBC complements regional ecosystem mapping and the Statewide Landcover and Trees Study to provide comprehensive mapping and reporting on vegetation extent and condition in Queensland.
Mapping vegetation condition for biodiversity provides information to support biodiversity conservation and natural resource management decision-making. It is important for assessing habitat for threatened and non-threatened species and is a key requirement for existing and emerging natural capital accounting schemes and biodiversity offset markets.
The SBC framework uses machine learning techniques, site data and remote sensing land cover data to predict vegetation condition. The outputs provide maps of vegetation condition on a scale of 0–100 with higher scores representing better condition. The framework is systematic, repeatable, and able to incorporate new site-based and remote sensing data as they become available.
Spatial BioCondition methodology
Spatial BioCondition (SBC) is predicted using three main inputs to a machine learning model:
- Statewide preclearing Regional Ecosystems mapping, which provides the reference for areas with similar environmental characteristics (known as environmental domain).
- Site-based field training data, which is georeferenced (i.e. known location), has a known regional ecosystem (RE) and has a BioCondition score. Training data includes both reference state sites (referred to as ‘best-on-offer’) and sites in a range of condition states from good to poor condition.
- Statewide data derived from remote sensing, which provide information on land cover and trends in vegetation that can be used as proxies for vegetation condition indicators, such as cover and phenology (i.e. how the vegetation changes over time).
The machine learning model develops a mathematical relationship between on- ground site information about BioCondition and the remote sensing data. This relationship is developed for each regional ecosystem that has sufficient data in reference condition.
The model measures the relative difference between any location and its reference or ‘best-on-offer’ state. In other words, the model first looks at the values in the remote sensing data that represent the ‘best on offer’ sites for each regional ecosystem. It then compares other locations in the same regional ecosystem to the ‘best on offer’ or reference site values and uses the difference to model a relationship to predict condition based on how similar or dissimilar a given location is to its reference state.
Once this relationship is established for each regional ecosystem, the model can be applied to map BioCondition in areas where field data is not available. The result is a prediction of vegetation condition for biodiversity for each 30m x 30m area (pixel) for a specific year that can be combined to generate a bioregional map.
Spatial BioCondition mapping
The Spatial BioCondition (SBC) framework predicts and maps condition for biodiversity for most vegetated terrestrial ecosystems in Queensland.
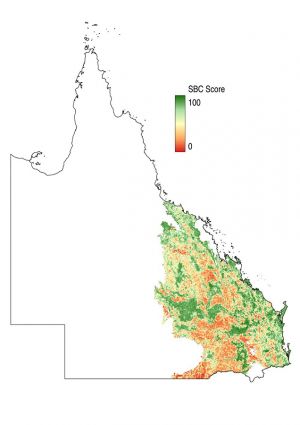
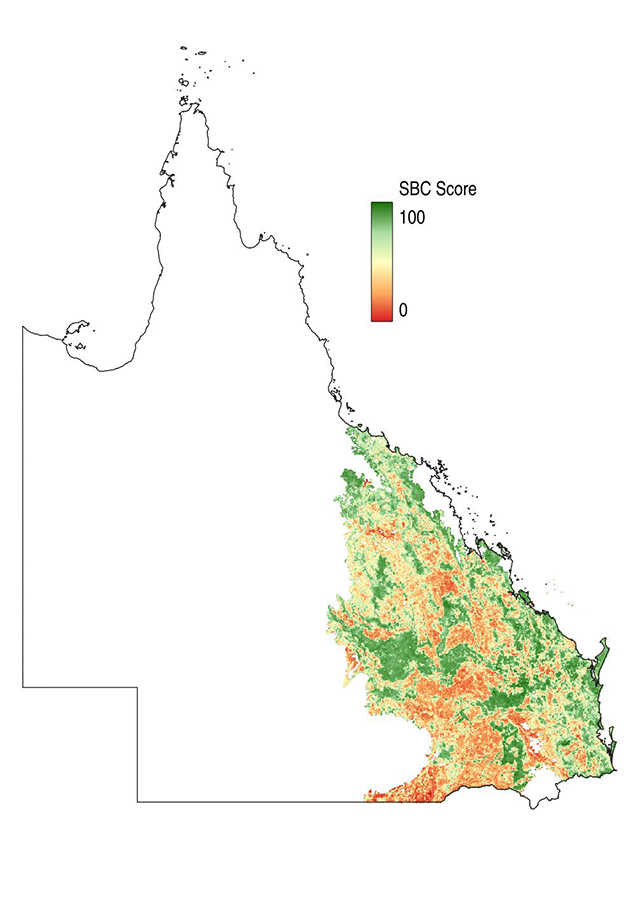
The current version of SBC: Spatial BioCondition of Queensland 2021 – version 2.0 provides condition predictions for the year 2021 for the Brigalow Belt, Central Queensland Coast and Southeast Queensland bioregions only (Figure 1). A Spatial BioCondition score has been generated for about 96% of the area covered by these three bioregions prior to masking exclusions.
The following areas are excluded from the current map:
- regional ecosystems with insufficient training data to apply the framework
- marine, intertidal, native grassland, sedgeland, forbland and predominantly unvegetated ecosystems
- urban, suburban, commercial, and industrial areas including intensive use lakes, estuaries, canals, dams and reservoirs.
It is important to note that SBC mapping does not identify nor attribute the underlying causes or drivers of condition for biodiversity. SBC is only intended to represent the vegetation condition at a given point in time, which in this current version is 2021.
Accuracy, scale and limitations
The accuracy of SBC predictions has been assessed using an independent field validation. Results indicated that agreement between the SBC predictions and the observed field data is about 70% with a mean absolute error of 13.4.
SBC is intended to be used for regional scale applications. Given the resolution of the predictions, it may be useful at more localised scales but as with any predictive modelling, it is likely to have some limitations at some locations. This is due to:
- the accuracy of the predictions which is affected by limitations in the available field data to represent the range of condition states in any one regional ecosystem
- inherent limitations of the various land cover data derived from remote sensing that are used to predict and extrapolate the model. In addition, some structural and compositional attributes of vegetation that have an important influence on biodiversity cannot be directly measured with remote sensing (e.g. plant species diversity) or are difficult to detect using current remote sensing data at the scale required (e.g. the amount of woody debris).
Access spatial data products
The spatial data for the current version of Spatial BioCondition mapping, Spatial BioCondition of Queensland 2021 – 2.0 for Brigalow Belt, Central Queensland Coast and Southeast Queensland bioregions is available for download from the Queensland spatial catalogue – Qspatial (using the search term ‘spatial biocondition’).
Resources
- Spatial BioCondition fact sheet 483.1 KB)
- Spatial BioCondition – Vegetation condition map for Queensland 4.2 MB). This report and the Spatial BioCondition framework were subject to an independent scientific peer-review in 2021, led by the CSIRO.
Contact
For questions about how to access Spatial BioCondition products, email queensland.herbarium@qld.gov.au.