Crop mapping
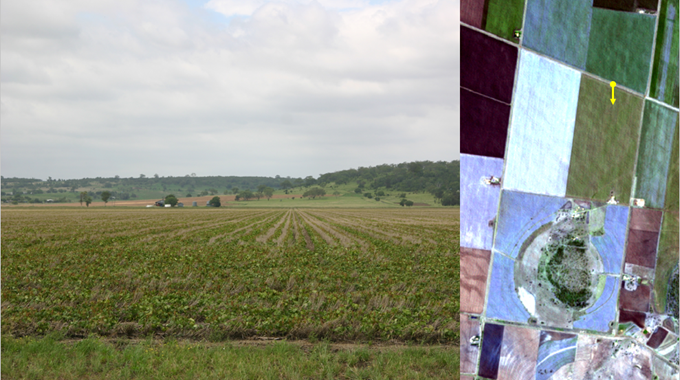
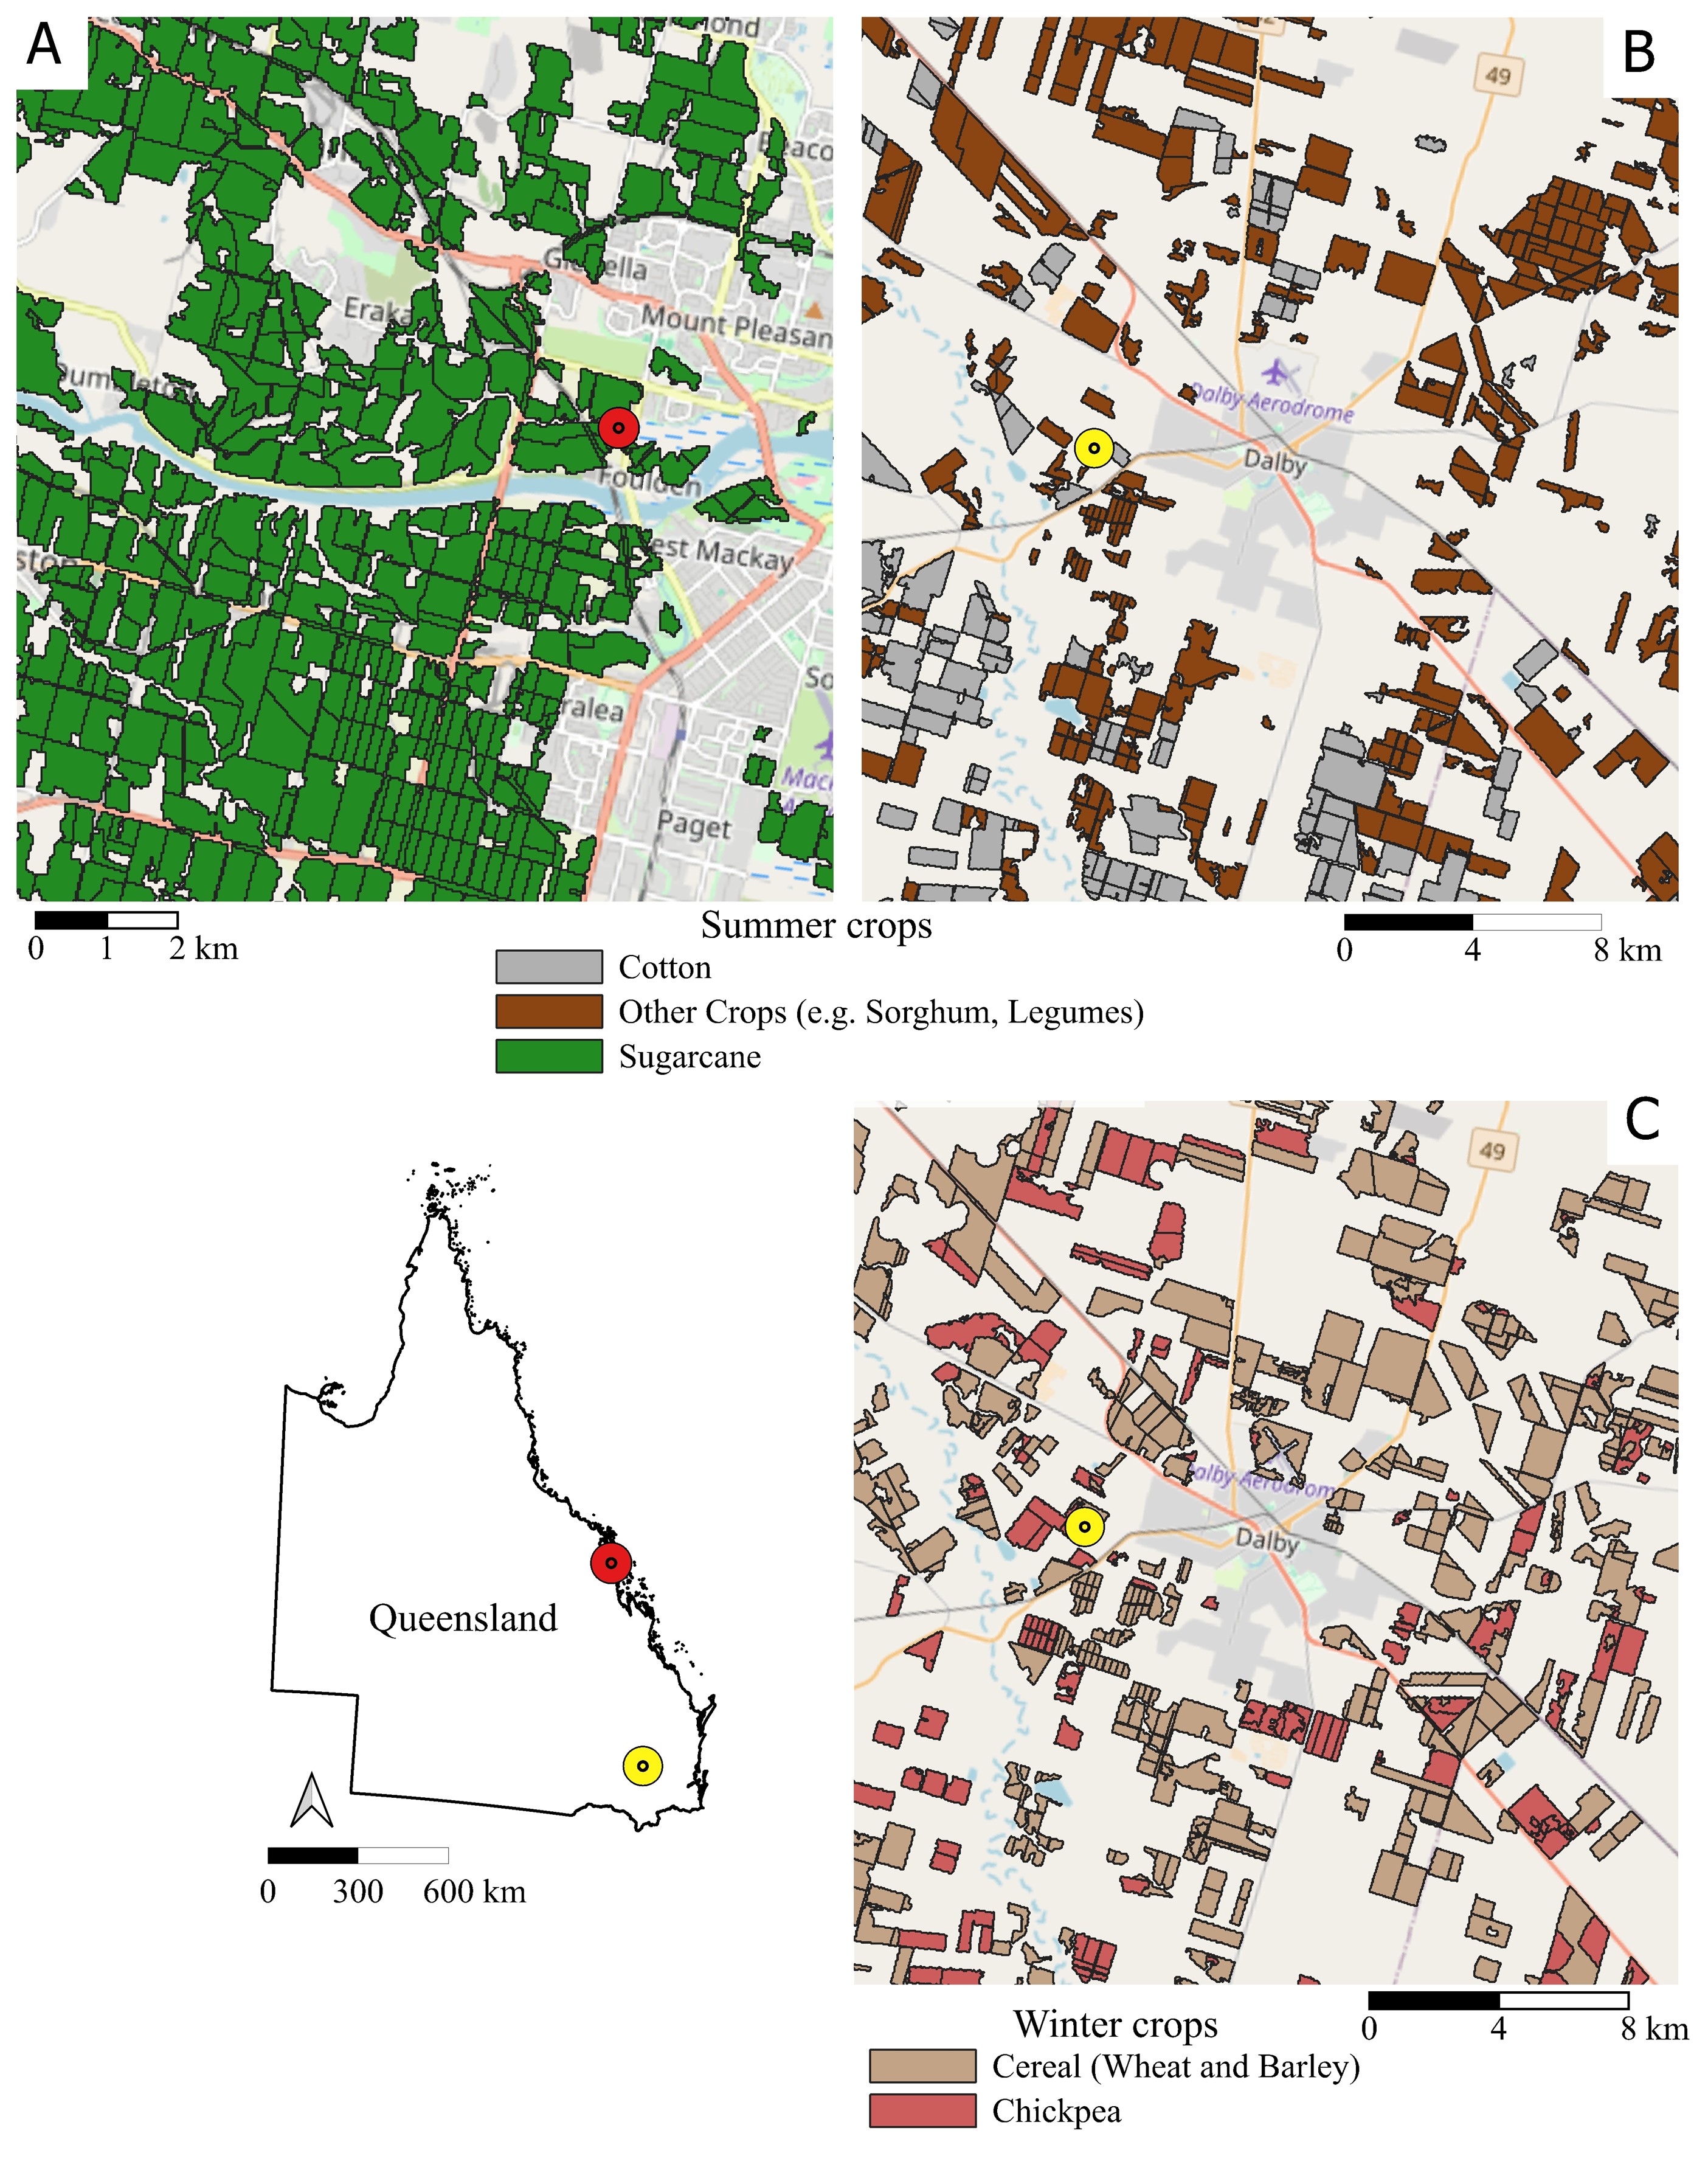
Remote sensing scientists use satellite imagery to detect the growth of broadacre crops in Queensland. They have analysed satellite imagery back to 1988 and produced an archive of two maps per year: one for winter-growing crops (i.e. June to October), and one for summer-growing crops (November to May). In summer the crop maps show these classes:
- ‘Cotton’.
- ‘Sugarcane’.
- ‘Other’ (predominantly sorghum, but also includes maize, peanut, soybean, and mungbean).
In winter, two classes are mapped ‘Cereal’ (wheat and barley) and ‘Chickpea’. For simplicity, our scientists map sugarcane only in summer when it is generally in its peak growing period, even though it grows all year round.
How can crop maps be used?
Satellite-derived crop maps deliver spatially comprehensive information that can be used for a range of strategic planning activities, including:
- protection of strategic cropping lands
- improving our understanding of the water quality of rivers
- prioritising improvements to transportation infrastructure
- informing land valuations
- directing response efforts following a natural disaster
- studying the long-term effects of cropping on ecosystem services.
How are crop maps made?
To make a crop map, scientists process satellite imagery for a period of interest, in a high-performance computing facility. The basic procedure is:
- Download Landsat and MODIS imagery (the latter acquired between 2000–2024) from the United States Geological Survey, and Sentinel-2 imagery from the European Space Agency.
- Pre-process the imagery to correct for sensor, atmospheric and landscape effects, to ensure different dates can be compared, and exclude areas covered by clouds and cloud-shadows.
- Assemble the imagery as a time-series. Calculate the seasonal vegetation parameters across the landscape.
- Apply a rigorously validated statistical model to predict the most-likely crop class across the landscape, according to the growing season and the seasonal vegetation parameters.
The primary source of satellite imagery is the Landsat mission. Landsat satellites have a 30-metre pixel size, and revisit every point on Earth as often as every eight days. Since 2015, Sentinel-2 imagery has also been included. Sentinel-2 has a revisit time of about five days and helps to fill gaps in the Landsat time-series due to cloud. Sentinel-2 has a pixel size of 10 to 20 metres but, for ease of use in the crop model, it is resized to 30 metres, to match Landsat. MODIS imagery, available since 2000, is acquired daily but has a relatively large pixel size of 250 metres. MODIS data have been used from 2000–2024 and serves only as a backup when there is a long absence of Landsat and Sentinel-2 imagery due to cloud or issues with data availability.
Where can I get the data?
Crop maps are available at:
- the Queensland Government’s QSpatial data catalogue (use the search term ‘Summer and Winter Crop Mapping 1990 ongoing); and,
- the Terrestrial Ecosystem Research Network.
Based on the historical archive of crop maps, reports that summarise the frequency of cropping, on a lot-on-plan basis, are available from the FORAGE reporting system.
Contact us
For more information about crop mapping, contact EOSSDataEnquiries@detsi.qld.gov.au