How to use the site
The quick reference table at the top of the wave monitoring sites provides a quick reference information of the most recent data for the wave height, energy period, wave direction and sea surface temperature at the top wave buoy locations.
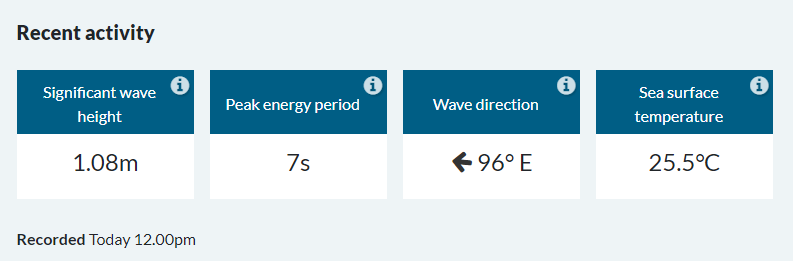
Where you see an information icon (info icon ), you can click to view an explanation of the measurement being displayed or you can refer to the Glossary.
Graphs
Exact measurements
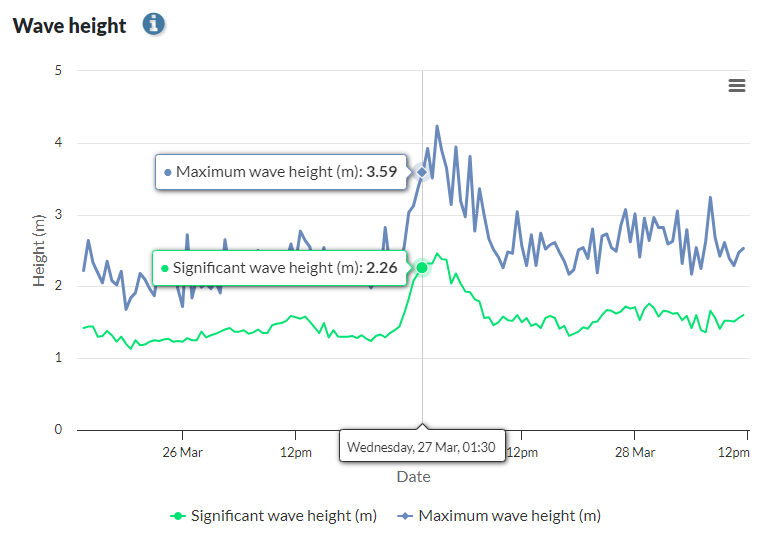
If you want to see the exact measurement for a particular point in time, you can hover your mouse, or tap the spot on your phone, and a label will display the data for that point in time. You can also view a table of all the measurements or download the data, see the downloading the data section below.
Changing the timeframe
The default view of the graphs show the previous three days of recorded data.
If you would like the graph to show a shorter timeframe, you can zoom in by clicking and highlighting the desired timeframe with your mouse, or by pinch and zooming on your mobile device.
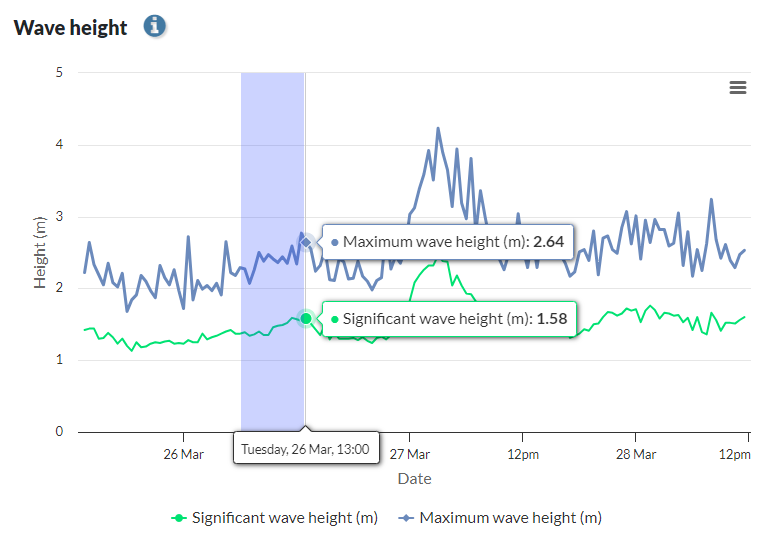
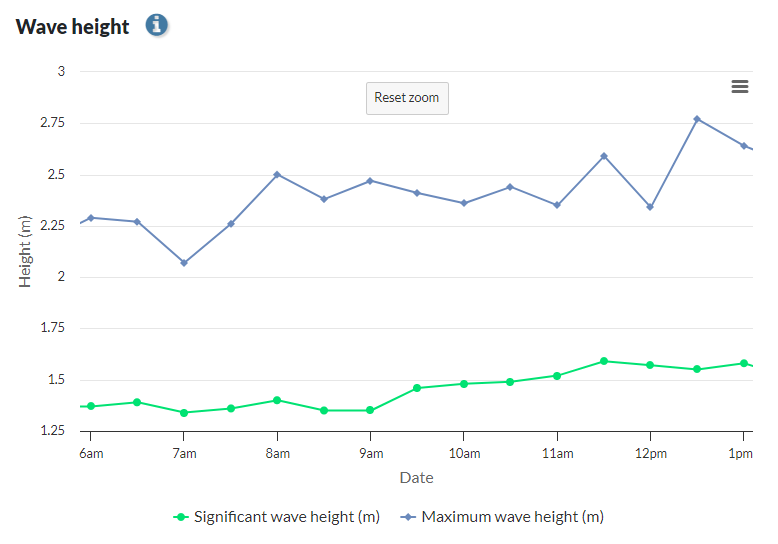
The graph will update to show more detailed information on the timeframe selected.
To reset the view back to the default, click the Reset Zoom button at the top of the graph.
Downloading the data
The graphs can be viewed in full screen, printed, shown as data tables below the graphs, or downloaded in the following formats:
- PNG
- JPG
- SVG
- CSV
- XLS.
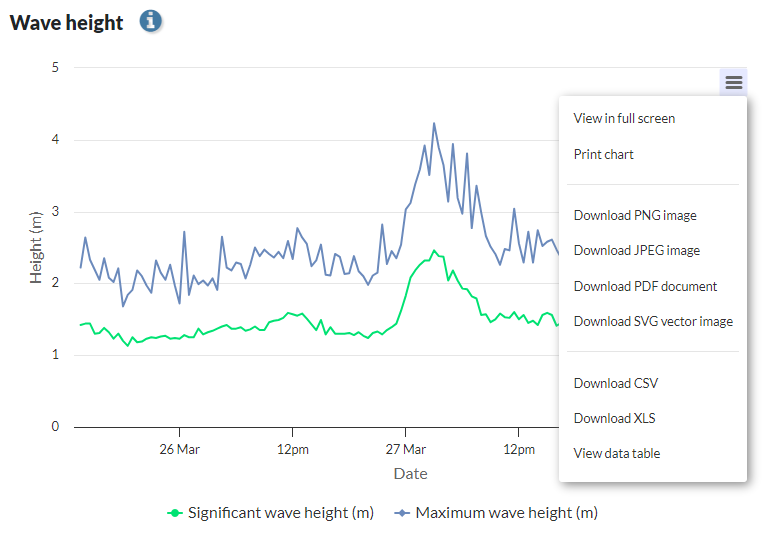
By clicking on the three lines shown at the top right of the graph, as shown below, a menu will expand, providing you with the following options:
- View in full screen
- Print chart
- Download PNG Image
- Download JPEG Image
- Download PDF document
- Download SVG vector Image
- Download CSV
- Download XLS
- View data table.
More detailed data
If you would like to download all the data for a specific wave monitoring buoy, or the last seven days of all the wave monitoring sites, there are links to download the data in the Site details section located towards the bottom of each page.
Wave buoys
The following information about the wave buoys is found at the bottom of each of the wave monitoring site pages.
- date of installation
- current location
- water depth
- the instrument being used.
Tide times
At the bottom of each of the wave monitoring site pages, a link to the Bureau of Meteorology website tide times is available.