


Cadastral maps
Cadastral maps were developed from survey plans and captured a graphic representation of property boundaries as well as displaying information about the property. They were used for the administration of land by councils, utilities and government.
With proclamation as a separate colony in 1859 Queensland assumed responsibility for performing surveys, preparing survey plans and compiling maps to facilitate administration. The Queensland Survey Office was established to carry out these duties under the leadership of Sir Augustus Charles Gregory.
Cadastral mapping of Queensland
The earliest maps drawn over Queensland showed the location of pastoral runs being leased.
By 1875, pastoral district maps at a scale of 20 chains to an inch (1:15,840) were being published.
In 1881, the first 16-mile to an inch (1:1,013,760) map covering all of Queensland in a number of sheets was released. It took three years to produce and was compiled from existing run sketch maps.
In 1887, the Moreton District 40-chain (1:31,680) maps were first published and the printing stones for the first electoral boundary maps were prepared. A new series of run maps also commenced that year. The 12-mile (1:760,320) series showing pastoral runs was improved to accommodate the joining of these maps to form a more extensive coverage.
In 1890, the new county series commenced. The first map in the series was of the County of Fitzroy. These were at a scale of 2 miles to an inch (1:126,720). It was unofficially reported that the first electoral map was published in this year.
A number of important decisions were made with regard to cadastral mapping in the late 19th century.
- It was decided to produce parish maps at a scale of 40 chains to an inch (1:31,680).
- Tenure of selected and alienated land was added distinguished by characteristic symbols and fonts.
- All the portions in the parish were listed on the side of the map with direct reference to the original survey plan.
The early 1930s saw the height of fine hand lettering on maps. The penmanship of the state’s elite draftsmen was almost perfection. Their skills were challenged and refined as they competed to complete the new series of 4 mile (1:253,440), 2 mile (1:126,720), 40 chain (1:31,680), 20 chain (1:15,840), town maps and a new state map.
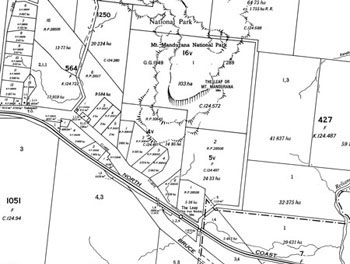
Around 1935, cadastral maps began to show real property information for the first time, like the actual length of property boundaries proving useful to the public.
The early 1970s saw the commencement of the production of the new 40 chain (1:31,680) sheet series based on the transverse mercator projection. This series eventually replaced the parish maps.
Conversion to metric
The change over from imperial measurements to metric on 14 February 1966 had a major impact on the production of cadastral maps. The Survey Office began the task of reviewing all map scales in 1971. By the mid-1970s, the department was producing metric mapping at scales of 1:100,000, 1:50,000, 1:25,000, 1:10,000, 1:5,000 and 1:2,500.
Related links
- Learn about Queensland’s historical mapping processes.
- View images of instruments and equipment used to survey and map Queensland.