Annual report for local government activities under the Food Act 2006
The 2024-25 Annual report for local government activities under the Food Act 2006 provides information on food regulatory activities under the Food Act 2006 (Food Act) undertaken by local governments in Queensland for the 2024–25 financial year.
Key findings from the report can be viewed on the interactive dashboard Key Findings – 2024–25 Local government reporting.
Local government areas (LGAs)
In Queensland, there are 77 local governments and one town authority (Weipa), which is administered by the mining company Rio Tinto. The Weipa Town Authority acts in the role of a local authority and as such, there are 78 local governments.
Download a map of local government areas (PDF, 994.87 KB).
Half of Queensland local governments have a population of over 10,000, including Brisbane City Council, which houses approximately one quarter of the Queensland population. Accordingly, there is major variation in the distribution of food businesses, the capacity of local governments and other factors that may limit regional comparisons.
Targeted compliance and regulatory actions undertaken by local governments are determined by local priorities and are not prescribed by the state. This provides local government with the discretion to target regulatory compliance activities within their boundaries and contributes to the variation in food safety compliance activities between local governments.
Report methodology
The methodology for collecting the data consists of a self-reporting survey that may be subject to misclassification, misinterpretation or user error. While care has been taken to clarify potential data discrepancies, some errors may not be easily identified and may therefore remain.
Fourteen local governments did not respond to the request made under section 28 of the Food Act, to report on their activities under the Food Act for the 2024–25 financial year. For these local governments, data provided for the previous reporting period of 2023–24 is used for the purposes of this report.
Report limitations
While this report provides activity data on select types of regulatory action undertaken, it does not include a full range of strategies and tools (such as voluntary food safety training and educational/promotional food safety strategies) that regulators may use to assist and engage with food businesses to achieve and maintain compliance with the Food Act.
The data also does not take into account that inspection, complaint and enforcement activity data may include food businesses that do not require a licence.
Licensed food businesses
There are 33,235 licensed food businesses throughout Queensland, a slight increase from the previous reporting period of 2023–24 (32,916 businesses).
A total of 6 local governments reported having no licensed food businesses, one less than 2023-24. An additional 15 local governments reported having less than 10 licensed food businesses, 2 more than in 2023–24.
Compliance rates
The compliance rate for licensed food businesses to have a food safety supervisor was 96%, a slight increase from the previous reporting period (93%).
The compliance rate for licensed food businesses with the requirement for them to have an accredited food safety program was 98%, a slight decrease from 2023–24 (99%).
Full-time equivalent (FTE) employees and inspection rates
A total of 24,206 routine inspections were conducted in the 2024–25 reporting period for licensed food businesses, that is, routine inspections were undertaken for approximately three-quarters (73%) of licensed food businesses, a slight increase from 2023–24 (24,141). Note that this does not include re-inspections or complaint-related inspections.
A total of 4,940 complaints regarding licensed food businesses were received by local governments and inspections (2,450) were conducted for only half of these food complaints.
Data relating to complaints against food businesses that do not require a licence was collected by 56% (44) of local governments, a slight increase from 2023-24 (47%). However, 61% (27) of these local governments reported that no complaints were received in relation to unlicensed food businesses in this reporting period.
The number of full-time equivalent (FTE) employees committed to food regulation for 2024–25 has remained relatively steady over the last 10 reporting periods. Statewide, there were approximately 157 employees committed to food regulation for the 2024–25 reporting period, a slight decrease from 2023–24 (163). This equates to approximately one employee per 200 licensed food businesses.
Contractors were used to perform some food regulation tasks for 38% (28) of local governments with licensed food businesses. This is a slight decrease from 2023–24, when 41% (29) of local governments with licensed food businesses used contractors.
Enforcement activity
Enforcement activity included 3,605 interventions, which included:
- 2,814 improvement notices issued
- 593 prescribed Infringement Notices (PINs) issued
- one seizure undertaken
- 101 show cause notices issued
- 8 licences suspended after a show cause notice
- 2 licences cancelled after a show cause notice
- 48 licences immediately suspended
- 38 prosecutions.
The only significant change in the number of interventions undertaken for each method of enforcement was the number of PINs issued (593), which increased by 22% from 2023–24 (486).
The number of food businesses that surrendered their licence continues to increase, despite the number of licensed food businesses remaining steady. The total of 707 licences surrendered is 10% more than 2023–24 (641), 56% more than in 2022–23 (453) and 43% more than in 2021–22 (494). There is no clear indication as to the reason for this continued increase.
Certain food businesses are required to be licensed by local governments under the Food Act, including:
- food manufacturers (e.g. manufacturers of bakery products)
- food businesses selling unpackaged food by retail (e.g. restaurants or catering businesses)
- non-profit organisations that sell meals on at least 12 occasions in a year (e.g. Meals on Wheels).
Licensing exemptions
Some licensing exemptions apply under the Food Act to food businesses in these general categories, including (but not limited to):
- the sale of pre-packaged food only
- the sale of whole fruit and vegetables or drinks such as tea, coffee, soft drink and alcoholic beverages
- primary producers of eggs, dairy, meat, seafood and specified horticulture that are accredited by Safe Food Production Queensland under the Food Production (Safety) Act 2000.
Licence locations around Queensland
The number of licensed food businesses in Queensland was 33,235, a slight increase from the previous reporting period of 2023–24 (32,916 businesses).
Of 8,797 licence applications received during the reporting period, 73% (48) of local governments reported that all licence applications received were processed in accordance with legislated requirements, including timeframes, a slight decrease from 2023-24 (50).
Of the 78 local governments, the following seven local governments reported more than 1,000 licensed food business, representing 65% (21,514) of licensed food businesses statewide, a slight decrease from 2023–24 (21,651):
- Brisbane City Council – 7,725
- Gold Coast City Council – 5,472
- Sunshine Coast Regional Council – 2,289
- Moreton Bay Regional Council – 1,993
- Logan City Council – 1,730
- Cairns Regional Council – 1,213
- Townsville City Council – 1,092.
A total of 6 local governments reported having no licensed food businesses, one less than 2023–24. An additional 15 local governments reported having less than 10 licensed food businesses, 2 more than in 2023–24.
Food business categorisation
Categorising food businesses can allow local governments to prioritise food safety tasks such as inspections, which can assist with planning and ensuring that adequate resources are available.
Local governments were asked to specify their primary method of categorising of licensed food businesses from a set list and the results are represented in the figure below.
The reporting identifies the 2 most common methods as business type and risk-based, consistent with the previous 3 reporting periods.
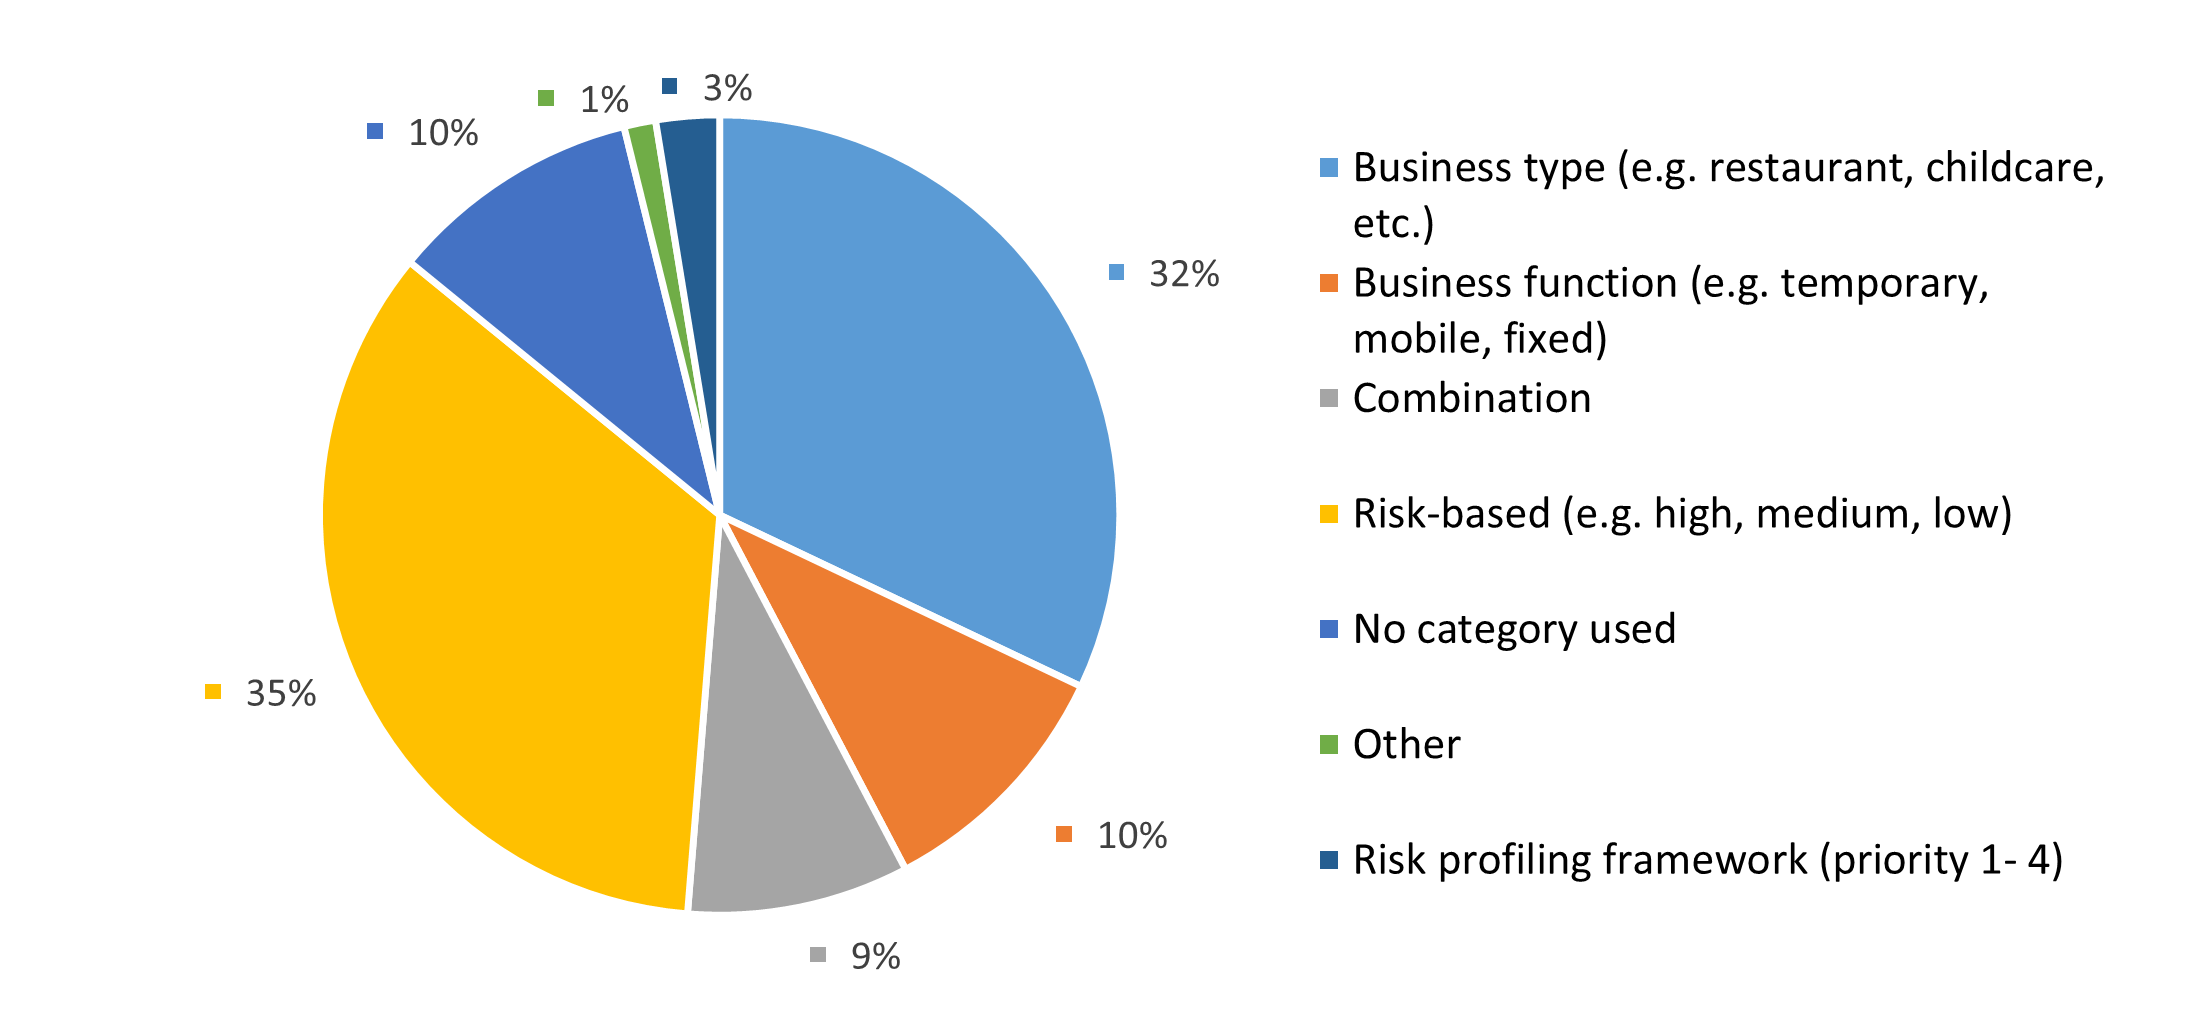
Note: Combination represents where local governments specified that more than one categorisation method is used.
Food safety compliance rate
Food safety supervisors
The food safety supervisor compliance rate has remained high over the past six reporting periods, with 96% (31,818) of licensed food businesses reporting at least one nominated food safety supervisor for the business during this reporting period.
Food safety programs
Under the Food Act, certain high-risk licensed food businesses are required to have a food safety program (FSP) accredited by their local government if:
- the food business involves off-site catering
- the primary activity of the food business is on-site catering
- the food business is undertaken as part of the operations of a private hospital
- a facility that processes or serves potentially hazardous food to 6 or more vulnerable persons (e.g. childcare and aged care centres)
- a facility whose principal activity is processing ready-for-consumption food that includes potentially hazardous food, for delivery by a delivered meals organisation to 6 or more persons at a time.
The compliance rate for relevant food businesses to have a food safety program has been consistently high, at a rate of 99% compliance over the past 6 reporting periods.
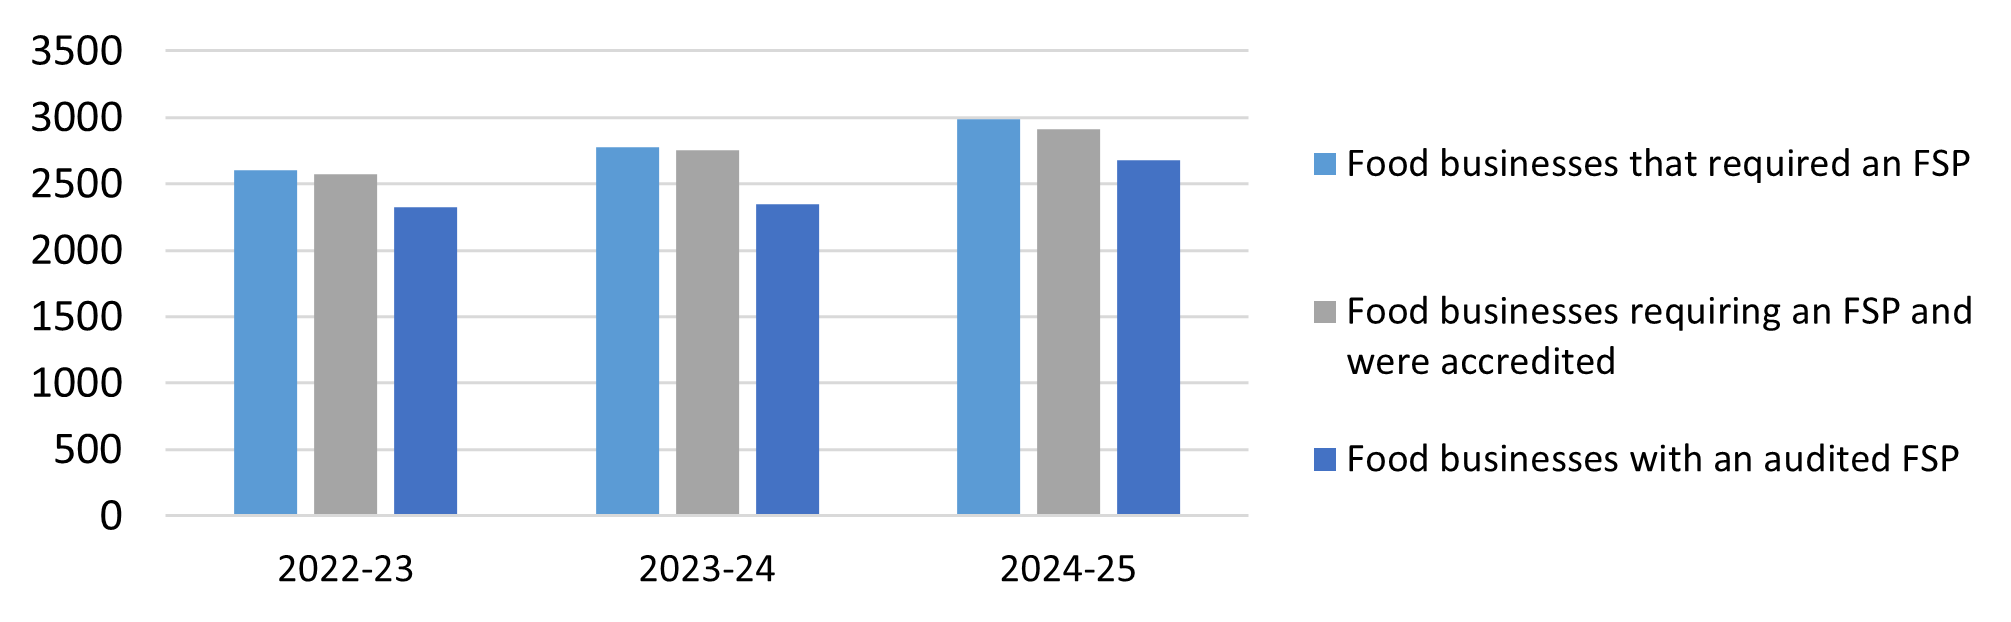
There were 2,984 high-risk food businesses requiring an accredited FSP. The number of food businesses with an accredited FSP that were audited by an approved auditor during the reporting period was 92% (2,346) of the total, an increase from 85% in 2023–24.
Food businesses’ compliance with accreditation and auditing requirements for this reporting period compared to the previous reporting period is shown in the figure below.
Local governments inspect licensed food businesses to assess compliance with the Food Act, the Food Safety Standards (Chapter 3 of the Food Standards Code) and the licence conditions of the food businesses. The Food Act does not specify the frequency of inspections.
Local governments conduct routine inspections based on factors such as the risk category of the food business (e.g. high, medium or low) and the compliance history of the business. The frequency of inspections may also provide an indication of a local government’s capacity to assess compliance of a food business with their legislative requirements in relation to food safety.
Local governments were requested to report on routine inspections and re‑inspections of licensed food businesses. A total of 12 local governments reported that data is not collected in relation to re-inspections. A total of 24,206 routine inspections were undertaken in the 2024–25 reporting period, which is 73% of all licensed food businesses, a slight increase from 2023–24 (24,147). An additional 4,785 re-inspections were reported.
Investigating food safety complaints
Local government receive a variety of complaints from the public regarding unsafe practices at food businesses or regarding food purchased. Some examples of complaints include dirty or unhygienic food premises, undercooked food, poor food handling practices, vermin or animals in a food premises and alleged foodborne illness. The number and type of complaints received can vary greatly.
Local governments were requested to provide the total number of complaints about food businesses that they received during the reporting period. They were not asked to categorise these complaints due to the complexities associated with varying data collection methodologies within individual local governments.
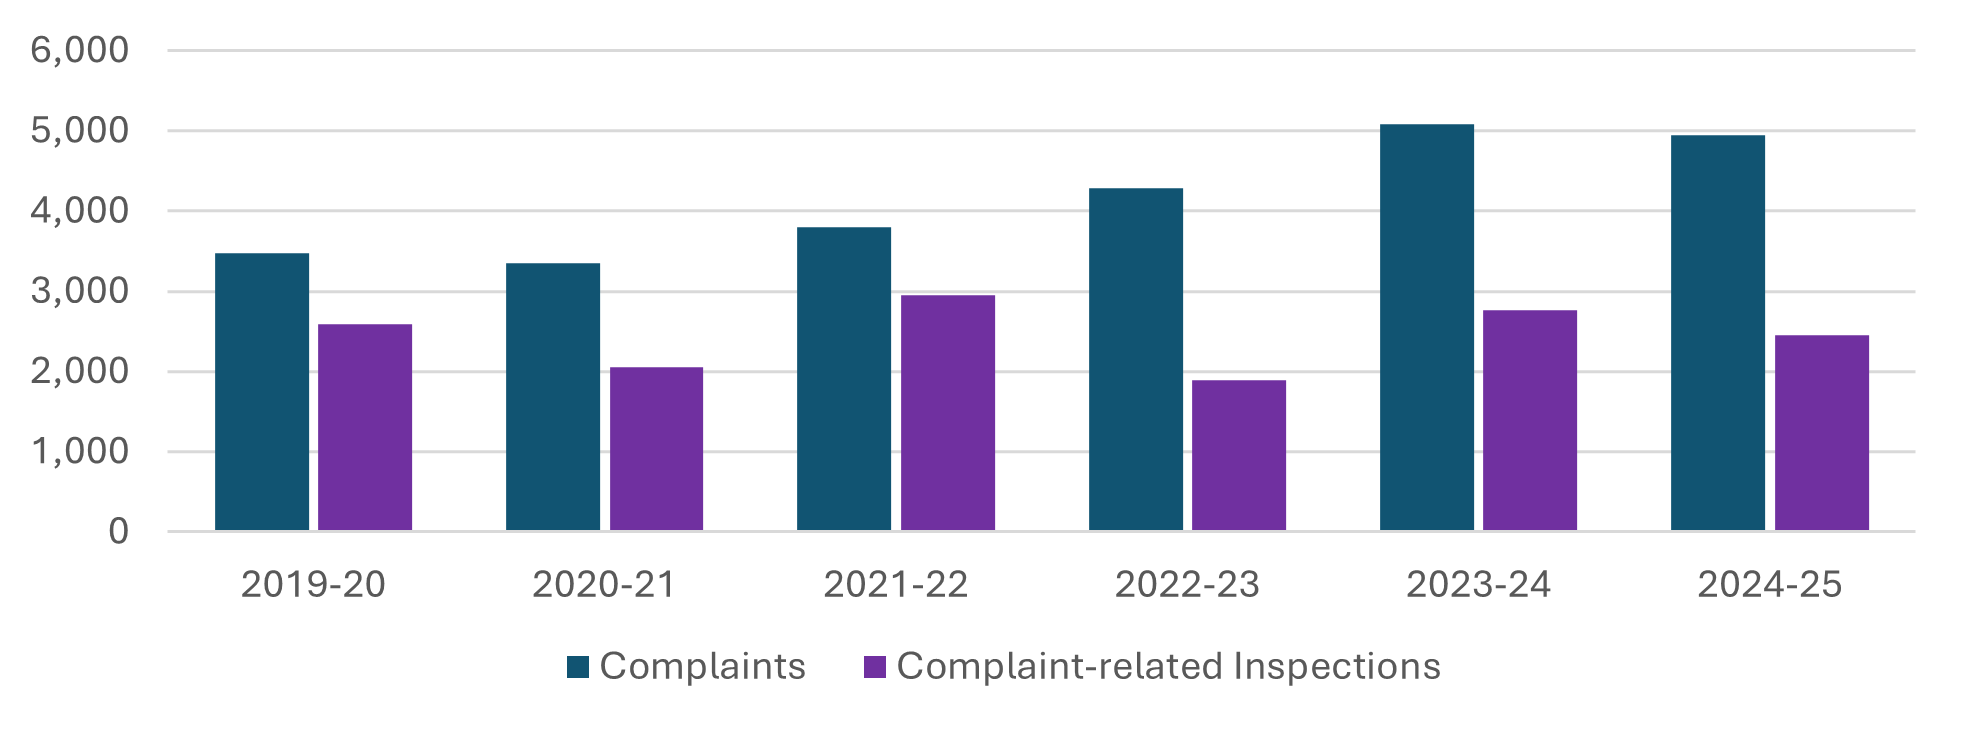
The number of complaint-related inspections undertaken compared with the number of complaints received provides an indication of whether complaints are being investigated via food business inspections.
For this reporting period, inspections (2,450) were undertaken for 50% of food complaints, a slight decrease from the inspection rate of 54% in 2023–24.
Despite the increase in the number of complaints over time, the number of complaint-related inspections undertaken do not increase accordingly, as shown in the figure below.
The Food Act provides a suite of enforcement options. The enforcement action taken by a local government should be graduated and proportionate to the severity of the non-compliance observed and any history of non-compliance. When considering enforcement data, it is important to note that in addition to enforcement actions, local governments use non-punitive actions such as education to assist food businesses achieve or maintain compliance with the Food Act. This report does not capture information from local governments in relation to other strategies used.
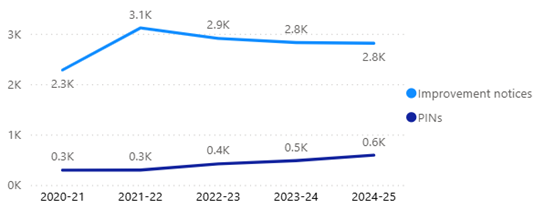
Consistent with previous years, the main type of enforcement activity undertaken by local government was the issuing of improvement notices, followed by prescribed infringement notices (PINs) as the second most common enforcement tool, as represented in the figure below.
Improvement notices
Improvement notices are utilised by local governments to address a variety of non-compliances within a food business. This may include issues such as the need to remedy cleaning, maintenance or structural contraventions or unsafe food handling practices. Improvement notices must provide food businesses with a reasonable timeframe to remedy any stated non-compliance.
Prescribed infringement notices
Prescribed infringement notices (PINs) may only be issued for offences that fall within the guidelines for eligible offences that have been acknowledged as PIN offences under the State Penalties Enforcement Regulation 2014. Only certain offences under the Food Act have been prescribed as PIN offences.
PINs can be issued when offences pose a moderate threat to human health and safety, or where there are indications of previous, current and ongoing non-compliance, such as failure to comply with a licence condition (section 51(1)) or failure to comply with the Food Standards Code (section 39(1)). The penalty unit values for PINs are relative to the severity of the offence.
While the issuing of PINs remains the second most frequently used type of enforcement activity, the number of PINs issued within the 2024–25 reporting period (593) increased by 22% from 2023–24 (486).
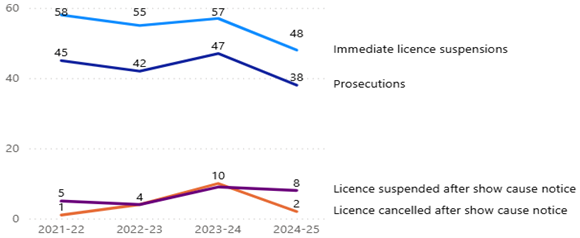
The annual trend in relation to other enforcement activities undertaken by Queensland local governments are shown in the figure below.
Suspension and cancellation of a licence
Section 78 of the Food Act allows local governments to suspend or cancel a licence when the licensee:
- is not, or is no longer, a suitable person to hold a licence
- has not complied with the accredited food safety program and the non-compliance is likely to result in a high risk to public health or safety
- has a licence issued under false or misleading representation.
Licences can be suspended or cancelled following a show cause notice. Local governments can use the show cause notice provisions prior to taking proposed action such as suspending or cancelling the licence.
A total of 101 show cause notices were issued during this reporting period, resulting in 8 licence suspensions and 2 cancellations.
Licences may be immediately suspended if a ground exists to suspend or cancel the licence and it is necessary to suspend the licence immediately because there is an immediate and serious risk to public health or safety.
During this reporting period, there was a total of 48 immediate licence suspensions, primarily issued by Moreton Bay City Council (17) and Brisbane City Council (13).
Seizures
An authorised person has the power to seize a thing under the Food Act in certain circumstances, for example as evidence of an offence under the Food Act. One seizure was undertaken in 2024–25, a decrease from 2 in 2023–24.
Prosecutions
Prosecutions are usually initiated if there is a high threat to human health and safety, or if there is a known or expected ongoing non-compliance. Consequently, prosecutions are the least common, most resource-intensive enforcement tool utilised by local government.
For this reporting period, 38 prosecutions were undertaken and as per previous reporting periods, the majority were undertaken by Brisbane City Council (36).
Voluntary surrender of licence
Examples of when a food business may surrender their licence includes if the business is sold to another person or entity, or if the business ceases to operate.
The number of food businesses that surrendered their licence continued to increase. The total number of licences surrendered was 707, which is 10% more than in 2023–24 (641), 56% more than in 2022–23 (453) and 43% more than in 2021–22 (494). There is no clear indication as to the reason for this continued increase.
Most local government employees working in food regulation are environmental health officers (EHOs). It is important to note that EHOs are responsible for many areas in addition to food regulation, particularly those in rural and remote locations.
In some rural and remote areas, food regulation is carried out by contract EHOs employed on an as-needs basis. In some of the Indigenous communities, environmental health workers may fulfil this function as part of their duties. To support Aboriginal Shire Councils and to build the skills of environmental health workers, EHOs from local Public Health Units often provide advice on food safety issues and inspecting food businesses operating within the area.
Statewide, there were approximately 157 employees committed to food regulation for the 2024–25 reporting period, which is an 18% decrease from 2023–24 (163).
A total of 41% (29) of local governments with licensed food businesses reported that they use contractors. This is a small decrease from 2022–23, where 43% (31) of local governments with licensed food businesses used contractors to perform some food regulation tasks, a slight increase from 2023–24 (28).
The number of licensed food businesses in Queensland was 33,235, a slight increase from 2023–24 (32,916 businesses). These businesses continue to have generally high rates of compliance with legislated requirements including food safety supervisors, food safety programs and auditing provisions.
Information presented in this report indicates that local governments are effectively administering their devolved powers under the Food Act.
Reporting indicated that 73% (40) of local governments with at least one licensed food business processed all licence applications in accordance with legislated requirements, including timeframes. All except 2 local governments with licensed food businesses reported that food safety supervisor requirements are checked during food business inspections.
A total of 24,206 routine inspections conducted in the 2024–25 reporting period for licensed food businesses means that annual inspections are undertaken for approximately three-quarters (73%) of licensed food businesses, although this does not include re-inspections or complaint-related inspections.
During this reporting period, 4,940 complaints were received, a slight decrease from 2023–24 (5085). Data relating to complaints against food businesses that do not require a licence is collected by 56% of local governments, an increase from 2023-24 (47%). There were approximately 157 employees committed to food regulation for the 2024–25 reporting period, a slight decrease from 2023–24 (163).
A total of 41% (29) of local governments with licensed food businesses reported that they use contractors to perform some food regulation tasks, a slight increase from 2023–24 (28). Generally, contractors are employed for short periods at a time, which limits the capacity of the local government to perform food regulatory functions regularly or in a timely manner (e.g. responding to complaints).
A realistic aspiration of a food regulatory system is to ensure that a food business is subject to the same amount of regulatory scrutiny and enforcement,whether in a major city or a remote area. The key to ensuring consistency is inspection frequency. It is reasonable to anticipate that inspection frequency should be based on risk, including compliance history, with high-risk businesses inspected more regularly than lower risk businesses.
However, inspection data captured in this report does not provide the discrimination necessary to compare regulatory oversight between local governments. To do so requires inspection numbers to be provided for non‑licensed food businesses and to be based on a universal definition for risk and a specified frequency for each risk level. This will require a change in how local governments categorise food businesses.
Full report
Download the full 2024-25 Annual report for local government activities under the Food Act 2006.
Key findings dashboard
View key findings in the Local government activities under the Food Act 2006 2024-25 dashboard.
Related resources
- Local government reporting guidelines
- Food safety documentation for local government officers (including previous annual reports)
- Mobile food vehicle register
- Queensland portal for food safety and regulation for food businesses
For further information in relation to the content of this report, please contact Food Safety Standards and Regulation via email at foodsafety@health.qld.gov.au or phone (07) 3328 9310.