


Wynnum Citizen Science Air Monitoring Project
The Wynnum Citizen Science Air Monitoring project (the project) was established to work with the community to address concerns related to dust pollution and air quality.
The project is a collaboration between the former Department of Environment and Science, the Bayside Creeks Catchment Group and community members of Clean Air Wynnum.
The project involved citizen scientists (participants) using low-cost particle sensors to measure particulate matter in real-time and assess against national air quality standards outlined in the National Environment Protection (Ambient Air Quality) Measure. The participants undertook deposition sampling during November 2018 and May 2019 to assess dust deposition (nuisance), and dust composition analysis using surface wipe and dust deposition samples to determine the types of dust present in Wynnum homes. The project commenced data collection (particulate matter) in December 2018 and concluded in December 2019.
Project phases
- Project scoping and community engagement (February –June 2018)
- Dust deposition and surface wipe sampling (November 2018)
- Air monitoring device installation begins (December 2018)
- First interim report released (April 2019)
- Dust deposition gauges redeployed (May 2019)
- Mid project report released (September 2019)
- Device collection and data analysis (December 2019)
- Final report released (April 2020)
Measuring air particles
Citizen scientists from Clean Air Wynnum used low-cost particle sensors to measure particulate matter (PM2.5 and PM10) in real-time and assess these against national air quality standards. Airborne particles are commonly measured in two different size distributions, being PM2.5 and PM10. These measures refer to particles that are less than 2.5 micrometres (µm) in diameter and less than 10 micrometres respectively. To safeguard human health and the natural environment, national air quality standards help to manage short or long-term air quality issues at local, national and regional levels.
PM2.5 particles are mainly generated by combustion processes, such as motor vehicle engines, industrial boilers, solid fuel heaters and fires.
PM10 particles are generated by combustion and non-combustion processes, including windblown dust, sea salt, industrial processes, motor vehicle engines and fires.
Air quality data was collected from the residences of the citizen scientists over a 12-month period. To further assist in the analysis of the data, citizen scientists recorded additional observations from their residences (such as fires, vehicle emissions, lawn mowing or barbecuing) that may have affected localised particle readings.
Air monitoring results
PM2.5 data collected in the project indicated that air quality in the Wynnum area is of good quality and fluctuated with local and regional events and meteorology throughout the year. Average PM2.5 concentrations were consistently below standard throughout the year, although air quality was most significantly impacted by bushfire smoke across Queensland during November and December 2019, where the project identified some exceedances. An exceedance was also identified in June and July 2019, which was likely the result of overestimations of particles in foggy or moist conditions due to the low-cost nature of the devices being used.
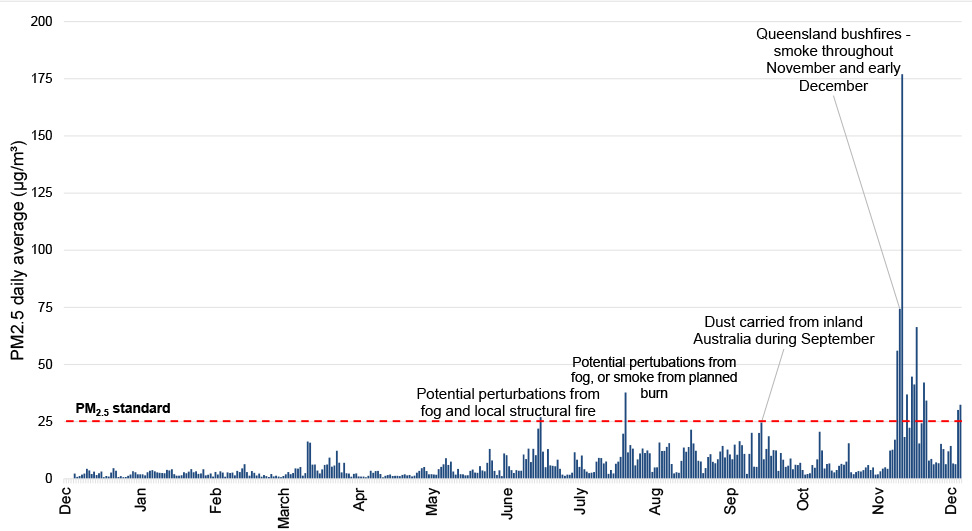
PM2.5 daily average graph (view larger image).
Similarly, PM10 data also indicated that air quality is of good quality in the Wynnum area. PM10 averages were also consistently below standard throughout the year, with significant exceedances during November and December 2019 due to bushfire smoke. An exceedance was also identified in July 2020, also likely due to overestimations due to fog.
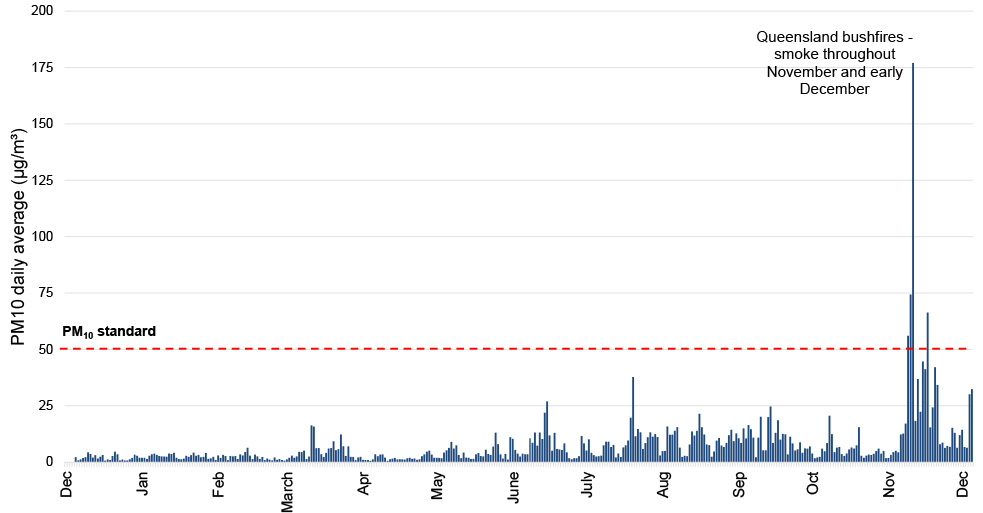
PM10 daily average graph (view larger image).
Overall, the project data indicates that air quality is considered good in the Wynnum area and was most significantly impacted by natural sources (bushfires).
Surface wipe dust composition – November 2018
Surface wipe sampling involved the collection of dust samples from various surfaces (such as tabletops, chairs and eaves) at the residencies of Wynnum citizen scientists. This was conducted in November 2018.
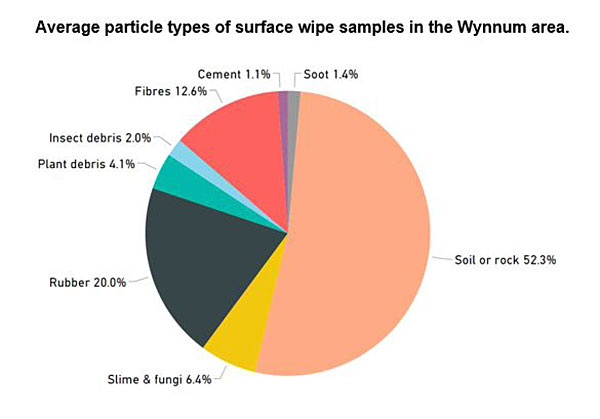
Surface wipes were analysed independently using an electron and stereomicroscopy to determine the type (and potential sources) of dust. The duration it has been there is unknown. Proportions of different types of particles are measured based on their surface area coverage, rather than particle mass.
This analysis method identifies a range of black-coloured particles (coal, soot and rubber dust), mineral dust particles (e.g. soil, rock, cement and glass), biological particles (e.g. insects and plants) and other general organic particles (e.g. wood, fibres, and plastics). Compositional analyses can also be an indicator of particle source. For example, black-coloured dust may consist of various particle types such as rubber dust from tyre wear, diesel or petrol emissions from transport, or mould.
The majority of dust from surface wipe samples consisted of mineral dust from soil or rock and black rubber dust. Other particle types common in domestic areas (e.g. plant and insect debris) were also identified. Coal was not a component of dust composition in surface wipe samples.
Dust deposition – November 2018 and May 2019
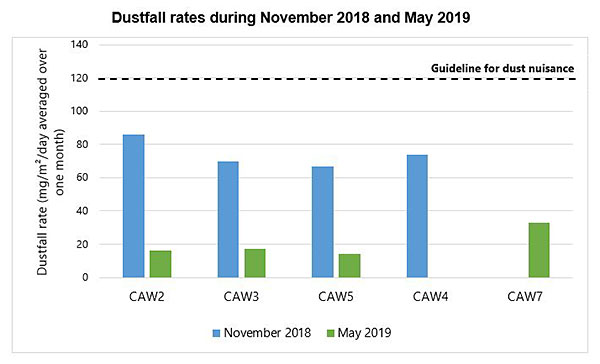
Dust deposition sampling involved participants housing dust gauges for the month of November 2018 and May 2019.Dust gauges consist of a two-litre collection bottle and funnel mounted on a PVC stand, designed to collect airborne particles that settle on the internal surface area of the funnel.
When samples are collected, insoluble dust is washed from the bottle then filtered, dried and weighed. Dust deposition is measured in mg/m²/day (milligrams per square meter per day). This provides a measure of how much dust settles over a given area and time under the influence of gravity (dustfall rate).
Dust deposition data will also help inform whether airborne dust is a nuisance. A guideline of 120mg/m²/day averaged over one month is commonly used to assess dust nuisance in Queensland.
All dustfall rates fell below the nuisance guideline during both November 2018 and May 2019.
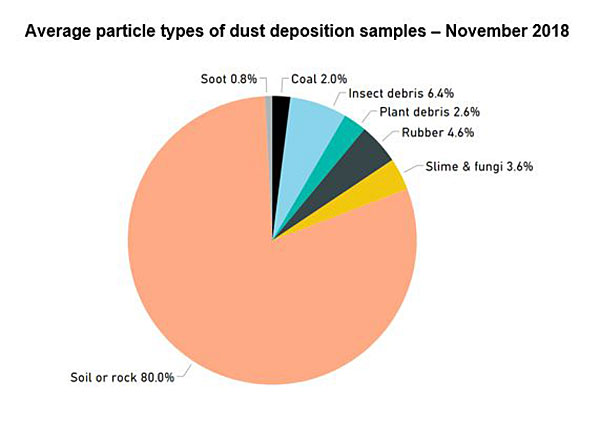
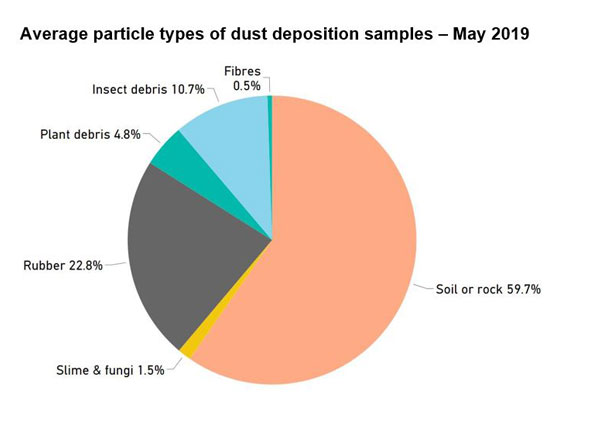
Dust collected from gauges were also analysed independently to determine composition and similarities to particles analysed in the surface wipes.
Dust deposition samples from November 2018 and May 2019 consisted mostly of mineral dust from soil or rock, with smaller proportions of black rubber dust and other particles common in domestic environments. Coal was not a significant component of dust gauge samples.
Note: CAW7 replaced CAW4 in May 2019.
Final project report – December 2018 - December 2019
The Wynnum Citizen Science Air Monitoring Project Final Report provides the results for air monitoring, dust deposition and dust composition from December 2018 to December 2019. The results indicate that air quality in the bayside area is of good quality, and fluctuates in response to regional influences, local events and meteorology. During twelve months of data collection, air quality was influenced most significantly by large regional bushfires. Coal was not found to be a significant contributor to air quality or dust pollution in Wynnum.
Acknowledgements are made to Clean Air Wynnum and Bayside Creeks Catchment Group for their valuable contributions to the project, and for raising awareness of local environmental concerns. As a collaborative citizen science project, it has demonstrated the value of community collaboration and the empowering the community in environmental issues. The outcomes and learnings from the project will help to inform future community engagement activities and response to environmental concerns to achieve positive outcomes for communities.
For more information about the Wynnum Citizen Science Air Monitoring Project:
- Mid project Report (December 2018 – June 2019)
- Mid project Report Fact Sheet
- Project Fact Sheet
- Project Interim Report (December 2018 – February 2019)
- Project Interim Report Fact Sheet
- Final Report