


Measuring multiple pollutants (DOAS system)
A Differential Optical Absorption Spectroscopy system monitors air pollutants based on their ability to absorb light.
A DOAS system is currently operating at the Gladstone CBD monitoring station, measuring:
A DOAS system previously operated at the Springwood monitoring station between 1999 and 2020.
The DOAS system
In addition to conventional single point monitoring instruments, we have 'open path' monitoring systems using Differential Optical Absorption Spectroscopy (DOAS) at some locations in the Queensland monitoring network.
The DOAS system works on the fact that different gaseous pollutants absorb light of different wavelengths.
The system has three main components: an emitter, a receiver and an analyser. The emitter sends a beam of light from a powerful xenon lamp over a selected path to the receiver unit. For ambient air quality applications, path lengths of several hundred metres are common.
There is a relationship between the number of pollutant molecules in the path and the amount of light absorbed. The analyser uses this principle, known as Beer-Lambert's absorption law, to measure pollutant levels.
It is possible to identify and determine the concentrations of several different gases in the light path at the same time because every pollutant has its own unique absorption spectrum properties, or 'fingerprint'.
The emitter unit
The image below shows the emitter unit where a concave mirror positioned at the rear of the unit focuses the intense light from the lamp into a near parallel beam.
The light beam includes visible, ultraviolet and infrared wavelengths.
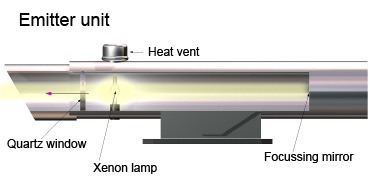
Illustration of a Differential Optical Absorption Spectroscopy emitter unit
The receiver unit
The receiver unit shown below uses a similar concave mirror to capture and focus the light from the emitter unit onto the end of an optical fibre that transmits the light to the analyser.
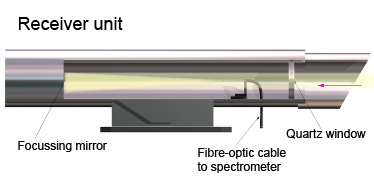
Illustration of a Differential Optical Absorption Spectroscopy receiver unit
The analyser
The analyser contains a spectrometer, which uses an optical grating to split the light into narrow wavelength bands.
A rapidly scanning detector breaks the signal into a large number of separate values that build up a spectrum at the desired wavelength.
Using complex computer calculations, the analyser measures the light losses due to absorption by pollutants along the path and compares the absorption curves with those of reference spectra to determine the best possible match.
This enables calculation of different gas concentrations with high accuracy.
The almost simultaneous measurement of many pollutants is possible using this technique.
How pollutant concentrations are measured
Step 1
The ambient air data absorption spectrum is stored in the analyser memory.
Step 1 spectrum
Step 2
The ambient air spectrum is divided by a ‘zero’ or system reference spectrum, recorded under conditions where no absorption for the measurement gases are present.
Step 2 spectrum
Step 3
By dividing the 2 spectra, the total light absorption along the light beam is obtained. This may be due to gaseous pollutants in the atmosphere, but also to dust or variations in the light intensity.
Step 3 spectrum
Step 4
As it is only gas molecules that cause rapid (or narrowband) variations in the absorption spectra, the slow (or broadband) variations (red line), which cause a rise in the gradient, are mathematically removed.
Step 4 spectrum
Step 5
Now all that remains are the rapid (narrowband) variations. Further calculations produce a differential absorption spectrum, which is a combination of the various gases present in the light beam at the moment of detection.
Step 5 spectrum
Step 6
The pollutants of interest already have their spectra stored in a reference library (examples A and B) and the analyser uses varying proportions of these spectra to create a best match with the measured absorption spectrum.
Step 6 spectrum
Step 7
The final step is to check the result by determining the difference between the measured and calculated curves (the blue and red lines) to give the standard deviation of the measurement.
A larger standard deviation indicates the presence of an unknown pollutant. The more reference spectra used, the more accurate the result.
If the standard errors exceed an acceptable tolerance, the measurements are rejected.
Step 7 spectrum