


November
About the Image
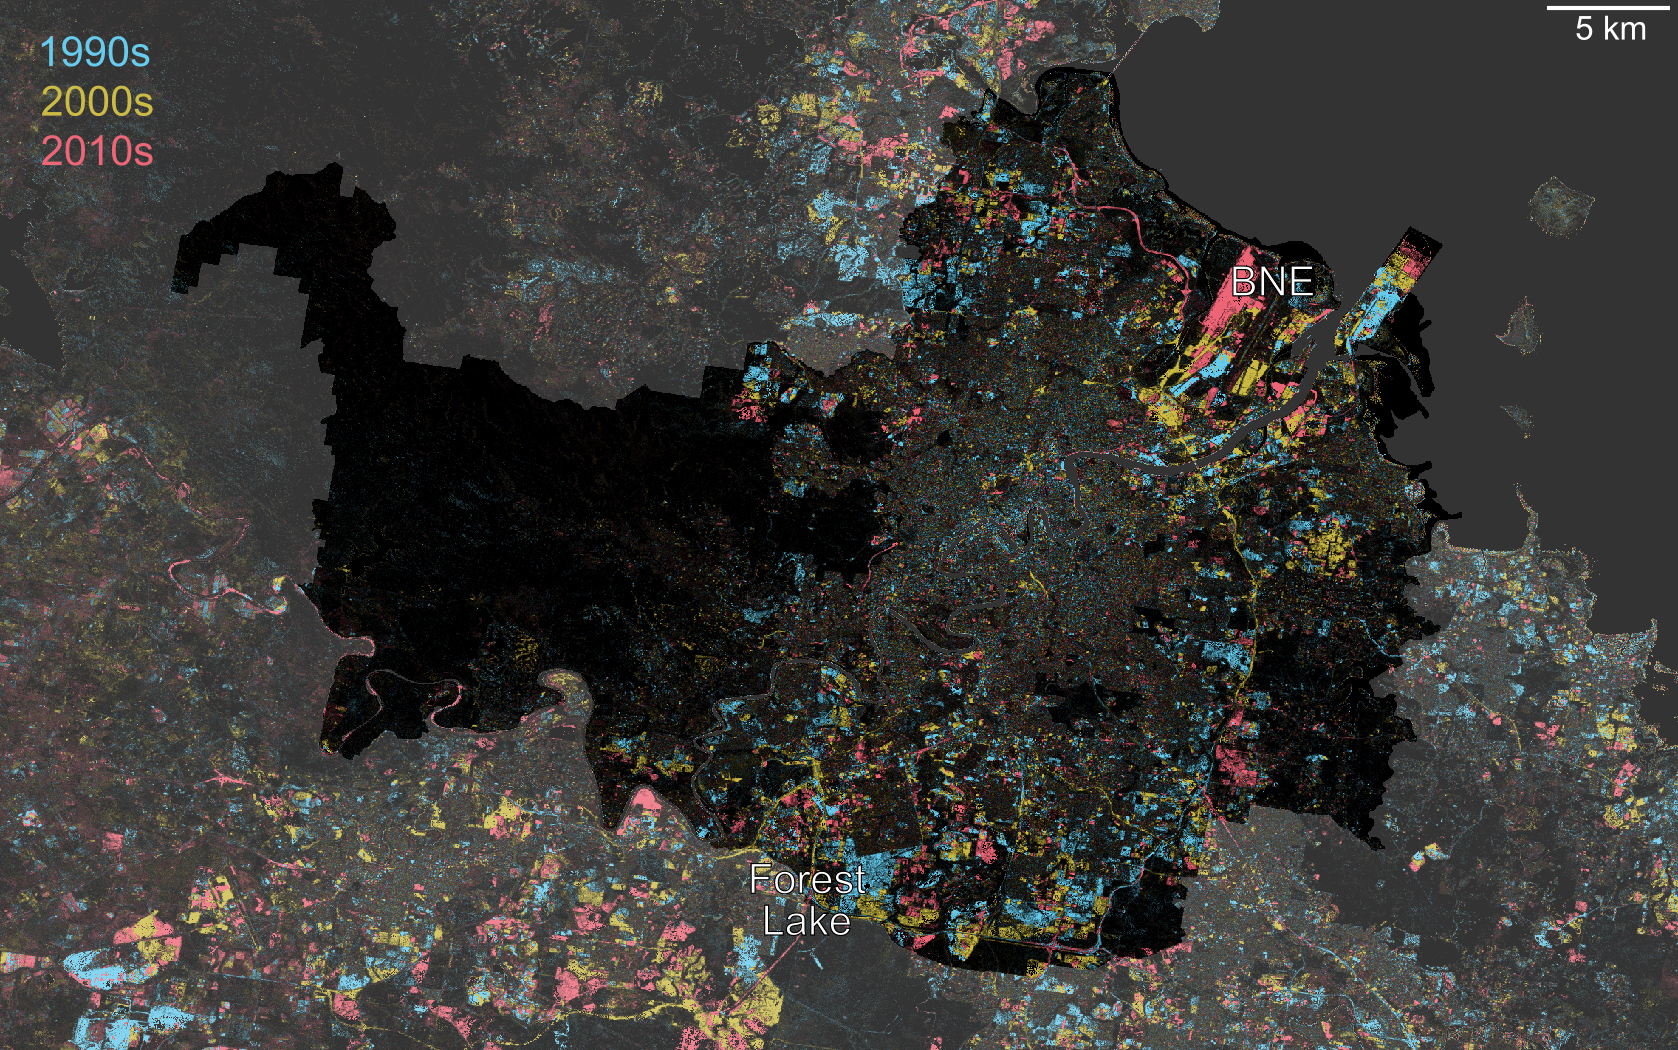
This image highlights changes in bare soil exposure throughout the limits of Brisbane City Council and surrounding areas, between 1990 and 2019. This provides an indirect illustration of the expansion of built-up area over the time period, as vegetated areas are replaced initially with bare ground, then buildings and other hard surfaces. For example, the large expansion of Brisbane airport this decade can be seen in magenta, while the progressive expansion of the nearby seaport can be seen in cyan, yellow and red. The timing of suburban developments to the south, north, and west of the city are also clearly shown; the development of the Forest Lake master-planned community in the 1990s is highlighted as an example.
Urban growth in South East Queensland (SEQ)
The expansion of built-up area has been driven by an increase in population, without a proportionate increase in dwelling density. Since 2004, SEQ’s residential population increased from around 1.5-million people to more than 2.5 million [1]. From 2001 to 2009, population growth across the SEQ metropolitan area was higher than nearly all metro areas in Australia, with the exception of Perth [2]. As a result, rural land management has become an important factor in strategic planning for SEQ. In general, population growth has occurred along three main corridors, extending from Brisbane north to the Sunshine Coast; west toward Ipswich; and south to the Gold Coast. By 2041, the population of SEQ is expected to reach 5.3-million people [3].
Technical details
Urban growth or increases in built-up structures such as new buildings and roads, can typically be seen from satellite imagery of suitable spatial resolution. However, quantifying this change over an extended period is not a straightforward process. Instead, we inferred the change in urban area by looking at changes in the proportion of each 30 x 30m pixel that was bare ground. We used a time-series of bare fractional cover from Landsat imagery [4], dating from 1990 to 2019. For each decade, we calculated the maximum year-to-year increase in bare fraction by simple differences over a respective decade (e.g., max [1991-1990, 1992-1991, etc.]). Then, we ascribed the decade with the largest bare-fraction change to each pixel. For example, for a given pixel, if the maximum year-to-year increase in the 2000s (i.e., 2000-2009) was larger than the maximum year-to-year increase in the 1990s, then we colour coded the pixel as yellow. If, instead, the 1990s change was greater, then the pixel was colour coded as cyan. Likewise, pixels where the change was greatest in the 2010s were colour coded as magenta. This kind of long-term time-series analysis is made possible by the free provision of Landsat imagery by the USGS, and processing capacity of the Queensland Remote Sensing Centre.
References
- Queensland Government 2009, South East Queensland Regional Plan 2009-2031, Queensland Government, Brisbane, QLD.
- Queensland Government 2010a, Queensland Growth Management Summit Background Paper: Opportunities Challenges and Choices, The State of Queensland, Brisbane, QLD.
- Queensland Government 2017, South East Queensland Regional Plan 2017 Shaping SEQ Background Paper 1: Grow, The State of Queensland, Brisbane, QLD
- Scarth, P., Gillingham, S., and Muir, J. 2008, Assimilation of spectral information and temporal history into a statewide woody cover change classification, in Proceedings of 14th Australasian Remote Sensing and Photogrammetry Conference, Darwin, NT, Australia, Vol. 29.