


Datasets
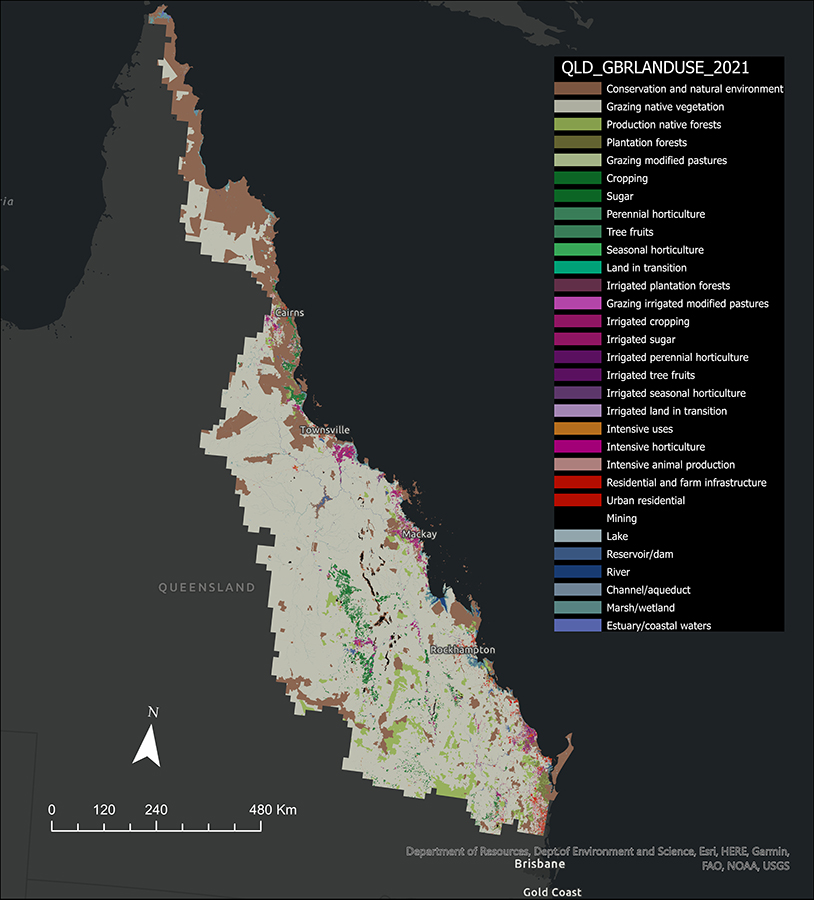
Land use datasets from 2009, 2011, 2012, 2013, 2015, 2016, 2017 and 2021 are available for selected Queensland catchments. Figure 1 shows the latest land use mapping in 2021 for the Great Barrier Reef (GBR) catchments.
The Queensland Government maintains a state-wide land use single layer, which includes the land use mapping products from 2011, 2012, 2013, 2015, 2016 and 2017. This dataset was last updated in June 2019.
You can download land use datasets through the Queensland Spatial Catalogue by following these steps:
- Go to 'search'.
- In the search terms field, enter "land use mapping" (including quotation marks) and select ‘go’.
- In the 'choose categories' drop-down list, select 'Planning Cadastre'.
You can also access summary reports of these datasets through reports and publications.
Access map and feature services
Use the Queensland Spatial Catalogue to access the web mapping services of the state-wide land use layer.
- Go to 'search'.
- In the search terms field, enter "land use mapping" (including quotation marks) and select ‘go’.
- In the 'content type' drop-down list, select 'Service'.
Request a land use map
You can request a PDF version of a land use map based on a specific location in Queensland. The location can be specified as a lot on plan, street address or central latitude/longitude coordinates.
Land use mapping over time
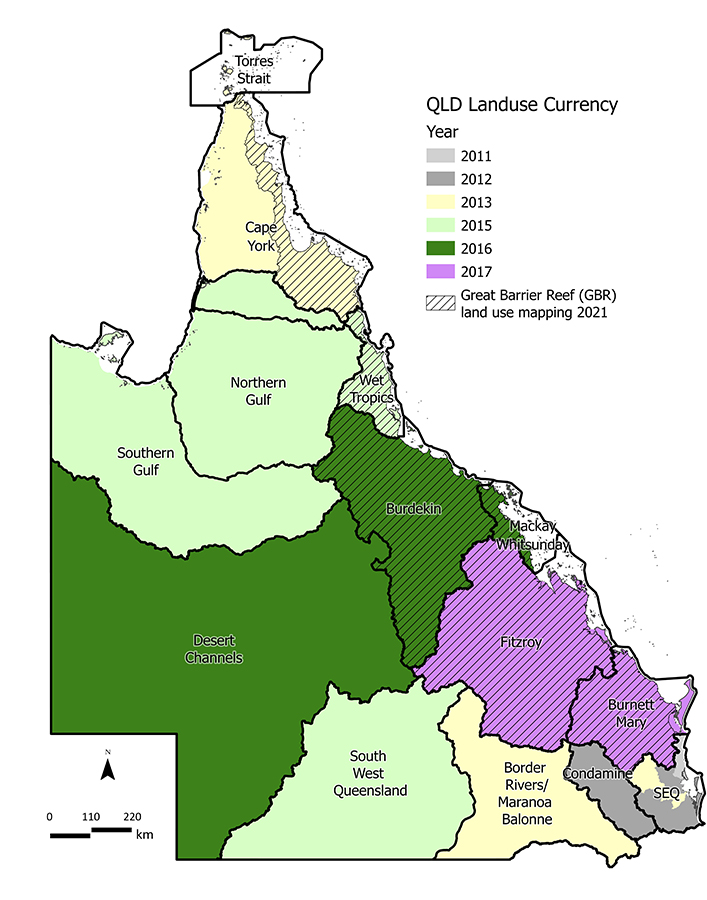
A consistent land use baseline map for Queensland was completed in 1999 with the state divided into 79 catchments within 15 Natural Resource Management (NRM) regions. Great Barrier Reef (GBR) catchments were recently updated to 2021 to support the Paddock to Reef Monitoring Program. Figure 2 shows the rest of the NRM regions and their associated land use mapping currency.
2021 land use dataset
The GBR land use mapping 2021 (Fig. 1) encompassed six Natural Resource Management (NRM) regions: Cape York, Wet Tropics, Burdekin, Mackay Whitsundays, Fitzroy, and Burnett Mary. Attribution of land use classes is based on a modified Australian Land Use Management Classification (ALUMC) Schema, Version 8 (October 2016). The ALUMC schema was aggregated to thirty-one land use classes. View the table showing the aggregation of ALUMC codes assigned to this dataset.
2017 land use datasets
Land use mapping for 2017 is available for the Fitzroy and Burnett Mary NRM regions. Mapping products include:
- updated land use for 2017
- revised land use for 1999 and 2009
- land use change for 1999–2017 (and 1999–2009, 2009–2017).
2016 land use datasets
Land use mapping for 2016 is available for the Desert Channels, Mackay Whitsunday and Burdekin NRM regions. Mapping products include:
- updated land use for 2016
- revised land use for 1999 (and 2009 for Mackay-Whitsunday and the Burdekin)
- land use change for 1999–2016 (and 1999–2009, 2009–2016 for Mackay Whitsunday and the Burdekin).
2015 land use datasets
Land use mapping for 2015 is available for the Wet Tropics, Southern and Northern Gulf NRM regions. Mapping products include:
- updated land use for 2015, including banana plantations at commodity level.
- revised land use for 1999 (and 2009 for Wet Tropics)
- land use change.
For the South West NRM region mapping products include:
- updated land use for 2015
- revised land use for 1999 and 2006 Land use change.
2011, 2012 and 2013 land use datasets
Land use mapping for the South East Queensland (SEQ) NRM region to 2011 or later is available, depending upon the most recent suitable imagery available. Mapping was compiled at the catchment level, except for the Brisbane catchment, which was divided into its sub-catchments (Brisbane River, Stanley River, Lockyer Creek and Bremer River) due to the size and diversity of land uses in the area. Apart from the Maroochy and Noosa catchment (2011) and the Brisbane River sub-catchment (2013), all remaining catchments in SEQ were updated to 2012.
Land use mapping for the Murray-Darling Basin and the Condamine NRM region are available to 2012, and for the Border Rivers, Moonie catchments and Maranoa and Balonne River catchments (Queensland Murray-Darling Basin) to 2013.
In far north Queensland, land use mapping to 2013 is available for Cape York and Torres Strait Islands NRM regions.
Mapping products include:
- revised 1999 (and 2006 where available) land use mapping including improvements and corrections to the original.
- updated 2011, 2012 or 2013 land use mapping.
- land use change mapping.
2009 land use datasets
Twenty-eight of the Great Barrier Reef catchments datasets to 2009 are available.
Mapping products include:
- updated land use mapping for 2009
- improved 1999 land use mapping
- land use change mapping for 1999–2009.
1999 land use dataset
The 1999 state-wide land use dataset covers 79 major drainage catchments in Queensland and was originally based on the Australian Land Use and Management Classification version 5.
As land use mapping was updated, the 1999 map was revised including improvements and corrections to the original. It was converted to ALUM Classification Version 8 (October 2016) and presents the most accurate land use mapping for 1999 in Queensland. The revised 1999 land use mapping was included in the current land use data package.