


Remnant regional ecosystem vegetation in Queensland
This report presents state-wide, bioregion and subregion analysis of remnant vegetation extent of regional ecosystems in Queensland for the period 1997–2021 and replaces version 12.2 statistics Accad et al. (2022). Version 13.0 updates information across the State and extends the monitoring period to include 2021. The report provides statistics on the extent of remnant regional ecosystem vegetation for the entire state of Queensland.
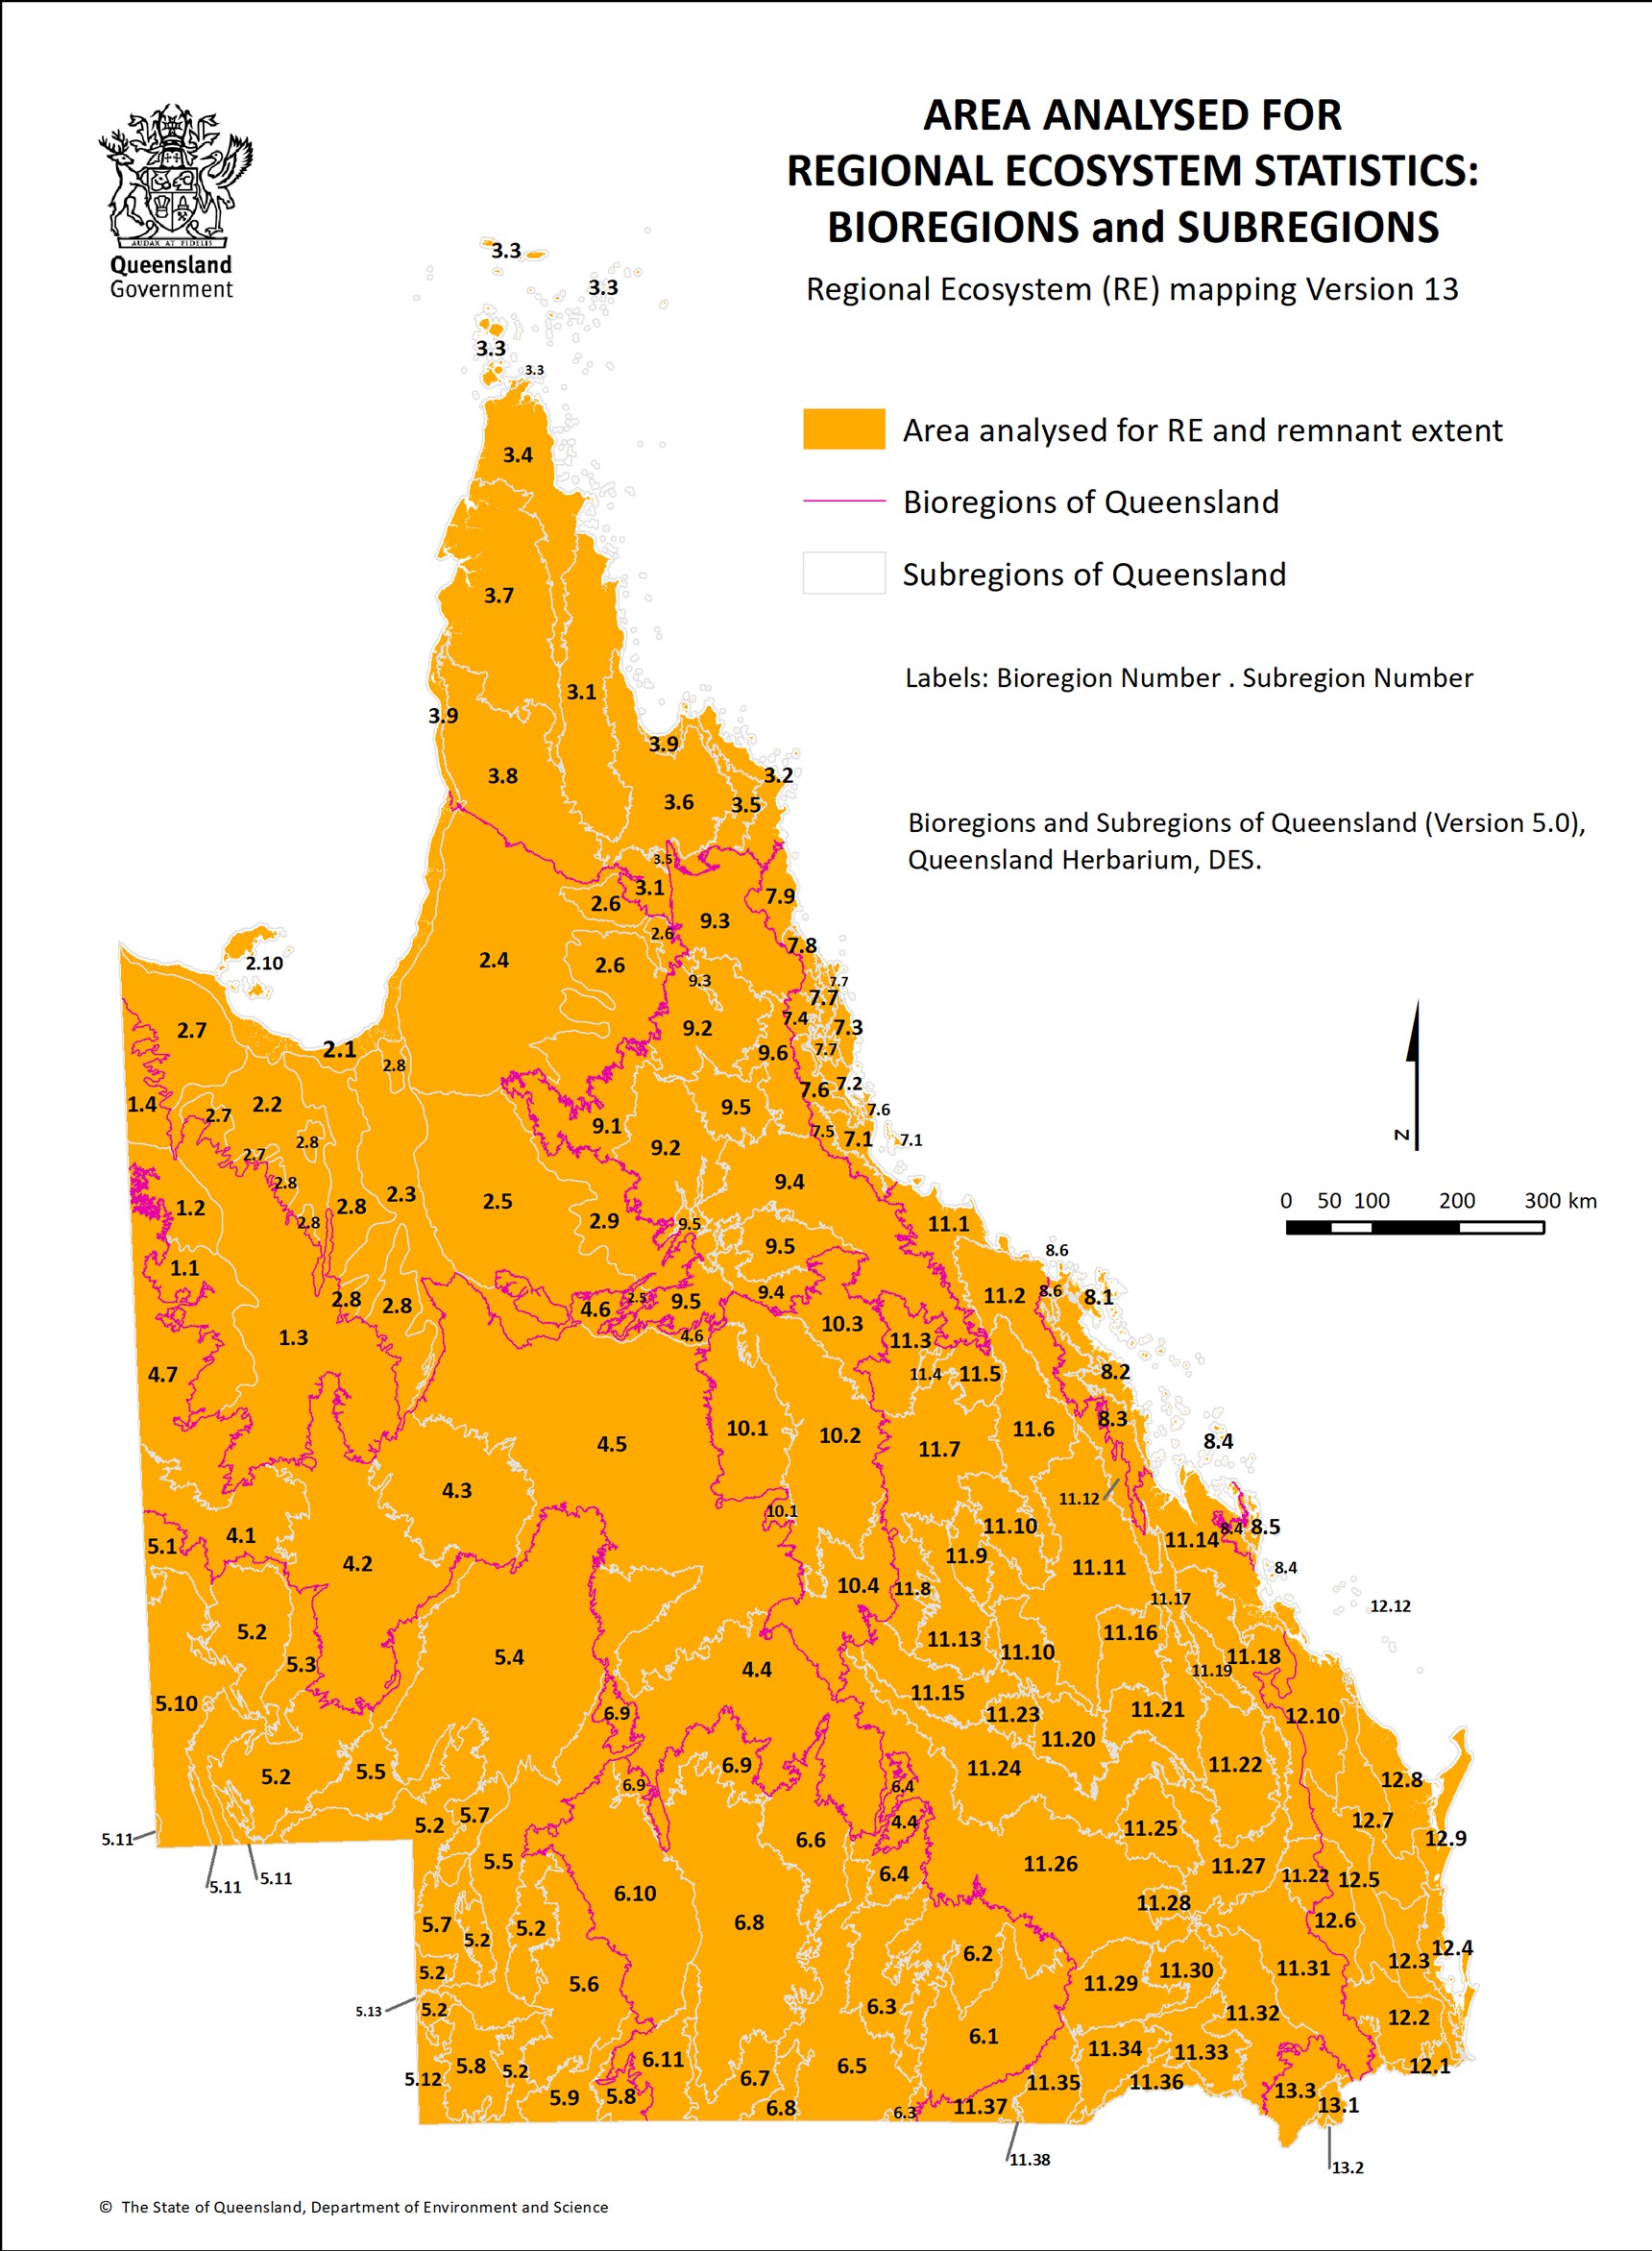
The report is based on the detailed regional ecosystem survey and mapping Version 13.0 Regional Ecosystems (2023) and Version 5.0 Bioregions and subregions of Queensland (Figure 1), which are available on the Queensland Globe and Open Data, QSpatial.
The report presents bioregional and subregional analysis of Queensland’s regional ecosystems pre-clearing extent and remnant vegetation extent at 14 points in time during the 24-year period from 1997 to 2021. The analysis includes the extent of clearing of remnant vegetation for individual regional ecosystems by tenure and several other themes. The rate of remnant vegetation clearing is also documented as hectares per year.
The report provides essential regional ecosystem extent information and consolidated maps to support state and local government, natural resource management organisations, business and landholders in vegetation management, planning and development.
- Bioregion and subregion analysis of remnant regional ecosystem vegetation 1997–2021
- Average annual clearing rate of remnant vegetation
- Remnant vegetation analysis by bioregion and subregion
- Regional ecosystem analysis by vegetation community
- Analysis by other themes
- Download tables and maps
- Appendix
The extent of remnant vegetation in Queensland has declined by 2.49% (4.3 M ha) between 1997 and 2021, and in 2021 covered 79.97% of Queensland (see Table 1).
| Year | Remnant (ha) | Percent of Queensland |
|---|---|---|
| Pre-clear (ha) | 172,857,233 | 100.00% |
| Remnant 1997 | 142,538,066 | 82.46% |
| Remnant 1999 | 141,652,269 | 81.95% |
| Remnant 2000 | 140,988,796 | 81.56% |
| Remnant 2001 | 140,751,112 | 81.43% |
| Remnant 2003 | 140,008,341 | 81.00% |
| Remnant 2005 | 139,535,545 | 80.72% |
| Remnant 2006b | 139,157,624 | 80.50% |
| Remnant 2009 | 138,989,508 | 80.41% |
| Remnant 2011 | 138,932,596 | 80.37% |
| Remnant 2013 | 138,847,562 | 80.32% |
| Remnant 2015 | 138,648,922 | 80.21% |
| Remnant 2017 | 138,420,178 | 80.08% |
| Remnant 2019 | 138,308,699 | 80.01% |
| Remnant 2021 | 138,226,365 | 79.97% |
Bioregion and subregion analysis of remnant regional ecosystem vegetation 1997–2021
Remnant regional ecosystem vegetation analysis by bioregion and subregion 2019–2021
The average annual rate of clearing of remnant regional ecosystem vegetation in Queensland between 2019 and 2021 was 42,552 hectares per year (Figure 2) and occurred in the:
- Brigalow Belt bioregion (32.2% of clearing in Queensland) largely within Northern Bowen Basin, Bogie River Hills, Southern Downs and Cape River Hills subregions;
- Mulga Lands bioregion (23.9% of clearing in Queensland) largely within Langlo Plains, Warrego Plains, Eastern Mulga Plains and North Eastern Plains subregions;
- Mitchell Grass Downs bioregion (18.4%) largely within Southern Wooded Downs and Central Downs subregions;
- Einasleigh Uplands bioregion (7.1%) largely within Undara - Toomba Basalts and Broken River subregions;
- Desert Uplands bioregion (4.8%) largely within the Alice Tableland and Jericho subregions;
- Southeast Queensland bioregion (4.7%) largely within Burnett - Curtis Hills and Ranges, Burnett - Curtis Coastal Lowlands and Moreton Basin subregions;
- Cape York Peninsula bioregion (4.4%) largely within Weipa Plateau subregion;
- Gulf Plains bioregion (2.5%) largely within Donors Plateau subregion;
- Central Queensland Coast bioregion (1%) largely within Clarke - Connors Ranges subregion;
- New England Tableland, Channel Country, Wet Tropics and Northwest Highlands bioregions each recorded less than 1% of the clearing of remnant vegetation in Queensland (see Figure 3).
In 2019–2021, 66% of remnant regional ecosystem clearing occurred on freehold tenure, with 25% on leasehold tenures, and 9% on other tenures.
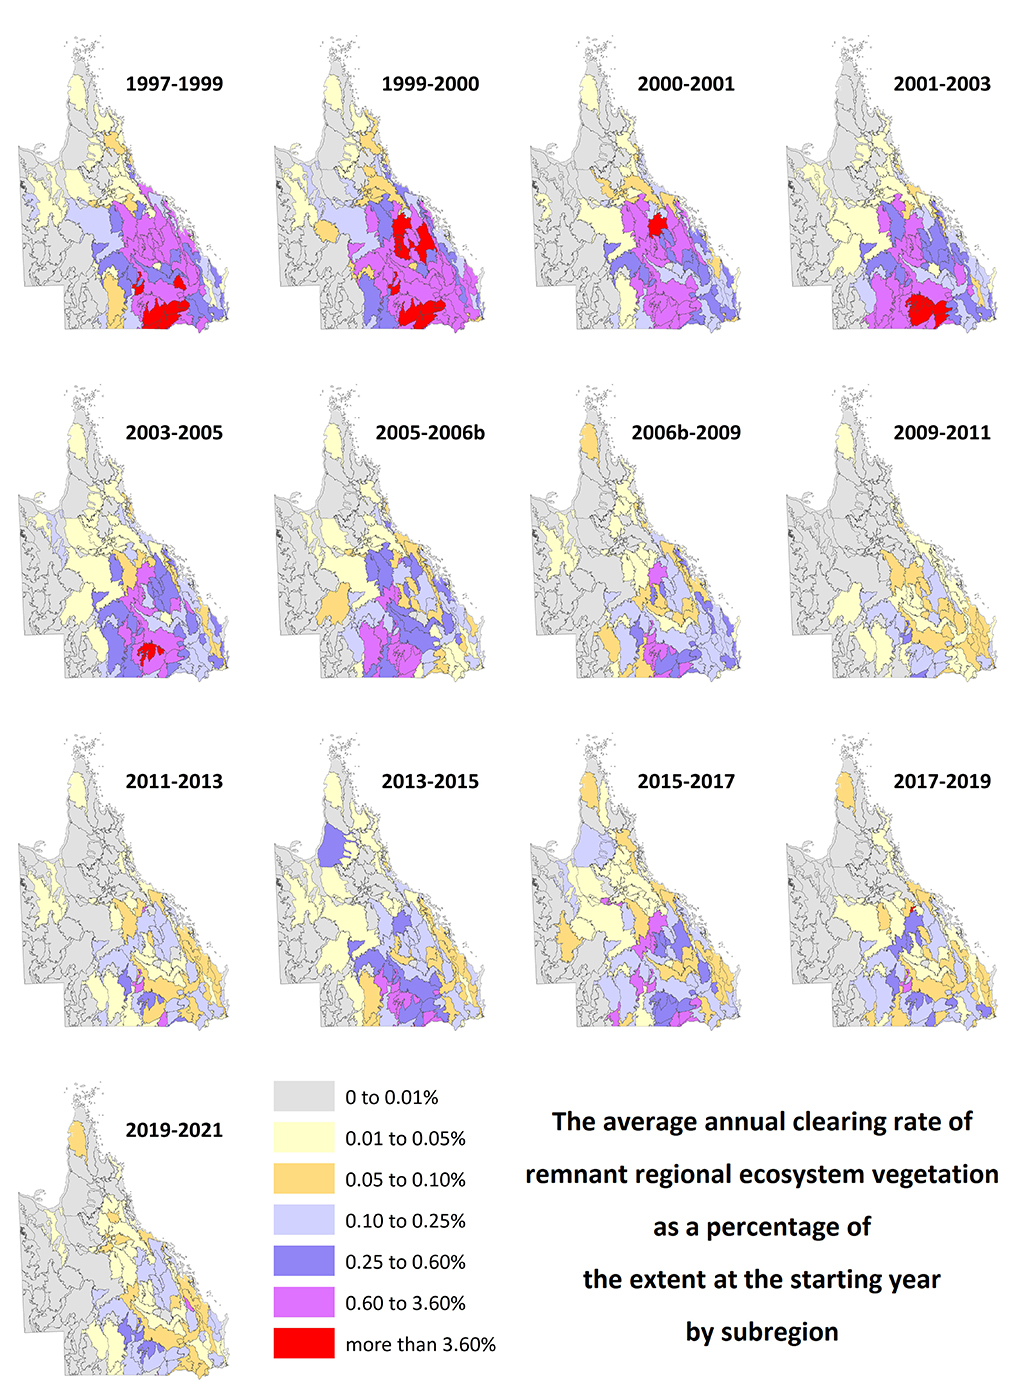
Average annual clearing rate of remnant regional ecosystem vegetation 1997–2021
Average annual clearing rates are calculated for each period accounting for the area cleared during the period and the number of days in the period. For all years the period begins in the ‘dry season’ and end in the ‘dry season’ except in 2006b the period refers to the ‘wet season’ from late 2006 to early 2007.

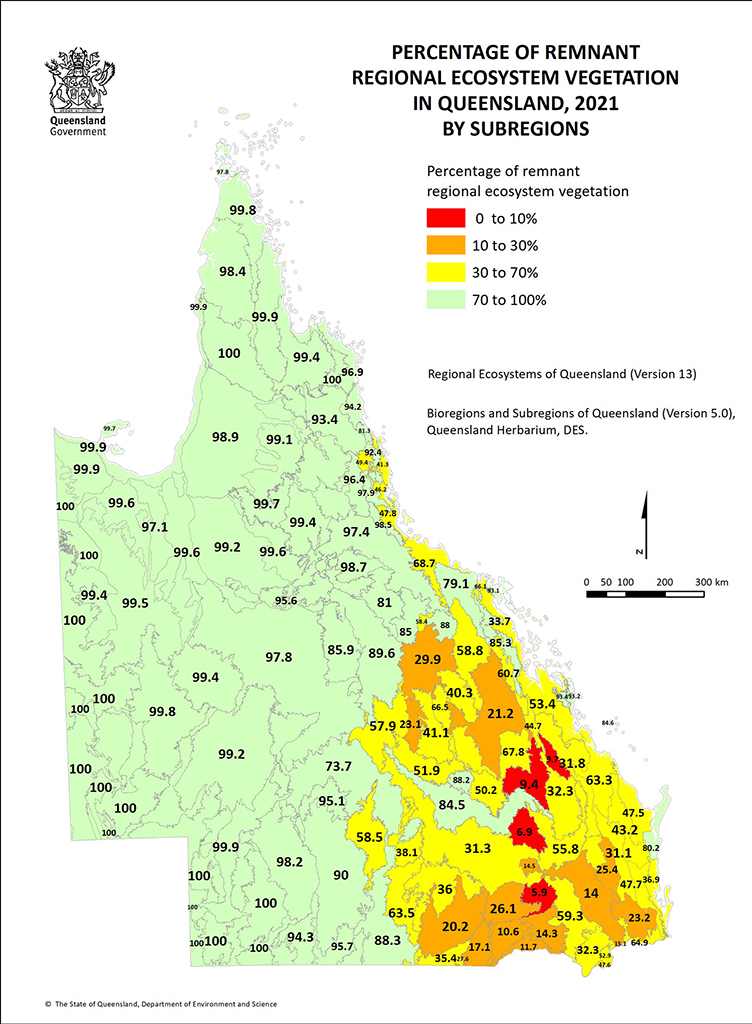
Bioregion and subregion analysis of remnant regional ecosystem vegetation shows that the New England Tableland bioregion (13.1-13.3 in Figure 1) has the lowest extent of remnant vegetation of Queensland’s 13 bioregions (36.1%). The Brigalow Belt bioregion (11.1-11.38 in Figure 1) has the second lowest remnant extent (41.1%) and includes the Tara Downs and Taroom Downs subregions which have the lowest subregional remnant extent in Queensland, with 5.9% and 6.9% respectively (Figure 4). The remnant regional ecosystem vegetation analysis MS Excel zip file is available from the download section below.
Regional ecosystem analysis
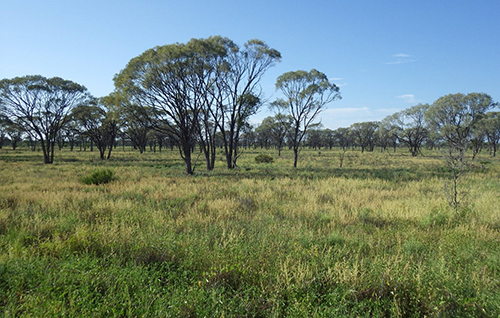
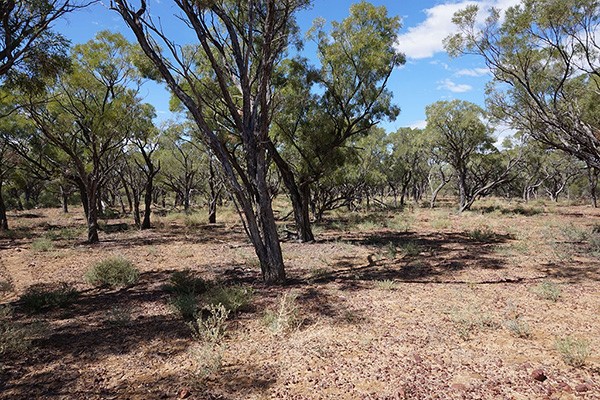
The regional ecosystems with the most remnant vegetation cleared during the years 2019 to 2021 are 4.9.7 and 4.9.11. These occur in the Mitchell Grass Downs bioregion and occupy similar environments, in many cases they are mapped together as a mosaic. They are the wooded component of regional ecosystem 4.9.7, Astrebla lappacea tussock grassland, wooded with Acacia tephrina +/- A. cambagei and Atalaya hemiglauca on Cretaceous sediments (Figure 5) with 4,289 ha cleared, and regional ecosystem 4.9.11, Acacia cambagei low woodland to low open woodland with scattered shrubs particularly Eremophila mitchellii but also Santalum lanceolatum, Geijera parviflora, Flindersia maculosa, Alectryon oleifolius and Carissa ovata can be present (Figure 6) with 4,038 ha cleared. The regional ecosystem analysis MS Excel zip file is available from the download section below.
Broad vegetation group analysis
The clearing of remnant vegetation during 2019-2021 mainly occurred in the following broad vegetation groups (BVG 1:5M):
- Eastern eucalypt woodlands to open-forests (BVG 3) 19,242 ha
- Acacia aneura (mulga) dominated open-forests, woodlands and shrublands (BVG 9) 14,867 ha
- Eucalypt dry woodlands on inland depositional plains (BVG 5) 13,260 ha
- Other acacia dominated open-forests, woodlands and shrublands (BVG 10) 11,730 ha
- Tussock grasslands, forblands (BVG 13) 9,149 ha
- Mixed species woodlands – open woodlands (inland bioregions) includes wooded downs (BVG 11) 4,691 ha
- Eucalypt open forests to woodlands on floodplains (BVG 4) 3,916 ha
- Rainforest and scrubs (BVG 1) 2,315 ha.
Analysis by other themes
The clearing of remnant vegetation during 2019-2021 (on percent basis) mainly occurred in the following:
- Catchments: Warrego River (15.2% of the total remnant clearing in Queensland), Barcoo River (13.7%), Thomson River (7.4%), Suttor River (5%), Isaac River (3.5%);
- Natural Resource Management Areas (NRM): Southern Queensland Landscapes (32% of the total remnant clearing in Queensland), Desert Channels Group (21%), NQ Dry Tropics (15%), Fitzroy Basin Association (12%) and Burnett Mary Regional Group (5.5%);
- Local Government Areas (LGA): Longreach Regional (15.6% of the total remnant clearing in Queensland), Murweh Shire (12%), Isaac Regional (7.6%), Maranoa Regional (6.7%), Blackall Tambo Regional (6.3%), Charters Towers Regional (5.1%) and Cook Shire (4.2%); and
- Queensland State Electoral districts: Gregory (29.3% of the total remnant clearing in Queensland), Warrego (26.1%), Burdekin (12.6%) and Traeger (10%).
Maps and statistical data for each of the above are available from the download section below.
Download tables and maps
NB: This report provides analyses of remnant regional ecosystems vegetation for the entire state.
Citation
Information contained on this report and available for download should be cited as:
Accad, A. Kelley, J.A.R., Richter, D., Li, J., Neldner, V.J. and Ryan T.S. (2023). Remnant Regional Ecosystem Vegetation in Queensland (Version 13.0), Analysis 1997-2021. Queensland Department of Environment and Science: Brisbane.
Appendix
Remnant vegetation includes both woody and non-woody vegetation as defined below.
Woody remnant regional ecosystems vegetation
Woody vegetation is mapped as remnant where the dominant canopy has greater than 70% of the height and greater than 50% of the cover relative to the undisturbed height and cover of that stratum and is dominated by species characteristic of the vegetation's undisturbed canopy.
An undisturbed stratum (or layer) is defined as one that shows no evidence of extensive mechanical or chemical disturbance (logging, clearing, poisoning, etc.) evident in field inspections or on the available historical aerial photographic record.
The Methodology for Survey and Mapping of Regional Ecosystems and Vegetation Communities in Queensland provides an assessment sequence for mapping vegetation cover (Figure 3).
Non-woody remnant vegetation
Non-woody vegetation is vegetation in which the ecologically dominant stratum is composed of grasses and /or other non-woody vegetation. Defining remnant status in non-woody dominated vegetation, such as grasslands, on the characteristics of the height and cover of the canopy (i.e. the grasses and forbs) is not practical.
The dominant layer in these vegetation types is highly variable according to seasonal conditions, and can be rapidly modified by grazing, fire or mechanical mowing. Neither can variations in its composition and condition be readily and consistently recognised from Landsat TM imagery. The Queensland Herbarium’s two-step process for mapping remnant grasslands and other non-woody vegetation types is therefore to:
Map the extent as remnant vegetation unless there is evidence from imagery of disturbance e.g. cropping in the last 15 years; or an on-site assessment disqualified it as remnant on the basis of species composition or cover.
Flow chart showing the assessment sequence for mapping cover can be found in Figure 3 within the Methodology for Survey and Mapping of Regional Ecosystems and Vegetation Communities in Queensland .
Related information
- Vegetation survey and mapping
- Methodology for Survey and Mapping of Regional Ecosystems and Vegetation Communities in Queensland
- Broad Vegetation Groups
- Request a map of Biodiversity Status or Broad Vegetation Group
- Regional Ecosystem Data; Queensland Data Portal and type "biodiversity status" into the search window.
- Regional Ecosystem Description Data Base (REDD)
- Queensland Globe Vegetation and regional ecosystem maps can also be viewed through Queensland Globe. After you’ve accessed the Globe:
- Zoom in to the area of interest on the map or use the search function.
- On the left-hand side of the screen, click Layers. An All Layers panel will appear.
- At the top of the panel, click Add layers.
- Click the down arrow next to Biota (Flora & Fauna) to expand that layer.
- Select Regional ecosystem mapping.
- Select the map/s you want to display.