


About storm tide monitoring
We maintain a network of storm tide monitoring sites along the Queensland coastline.
The storm tide network allows real-time access to sea level data during severe weather events so we can monitor the impacts of coastal inundation from storm surges.
The information collected during storm events helps improve forecasts and modelling of future events. It is of particular value during storm surges associated with tropical cyclones.
Our data is also useful for government when considering community evacuation.
Find out more:
- Who uses storm tide data?
- How are storm tides monitored?
- Online storm tide data
- Using storm tide data for an emergency
- Publications
Who uses storm tide data?
Queensland’s storm tide data is used by:
- planners and engineers in the design and construction of coastal structures
- scientists investigating natural coastal processes, including storm surge and sea level change studies
- the Bureau of Meteorology as the basis of tide predictions, forecasting and modelling of extreme events
- emergency services during extreme events
- individuals, tourism and recreational businesses for planning of marine activities
- maritime organisations to plan port activities and to support navigational safety.
How are storm tides monitored?
We use storm tide gauges to record the magnitude of storm tide events.
Storm tide gauges are built to withstand severe weather and storm surge.
Fortunately these events happen infrequently, so for the majority of the time, the storm tide gauges act as normal tide gauges recording the regular rise and fall of the tides.
The storm tide gauges measure water level with pulse radar sensors. They send a high-frequency radio pulse to the water surface. A water level is obtained by measuring the time taken for the radio pulse to travel from the sensor to the water surface and then reflect back to the sensor.
Data is stored every minute on a data logger for onsite storage. The data logger then automatically transfers the storm tide data over the internet to a central computer system (data server) in Brisbane for checking, processing and archiving. We then publish the data online—see our storm tide monitoring sites to view the data.
Online storm tide data
The data from a storm tide gauge is used to produce storm tide plots. The storm tide plots contain:
- the predicted tide level
- the actual tide level recorded
- the residual level
- an indication of highest astronomical tide (HAT) at the site.
The indication of HAT is important because this level is not usually reached by the tide under normal meteorological conditions.
If HAT is exceeded, some inundation from the sea is likely to occur. The extent of flooding is influenced by local topography and by how much HAT is exceeded.
Using storm tide data for an emergency
Emergency services and local governments use information from the storm tide gauges, together with maps of areas vulnerable to storm surges, to manage risk to the community.
The storm tide plot shown in the image was recorded during Tropical Cyclone Yasi in February 2011 at Cardwell, where a storm surge of approximately 5 metres occurred.

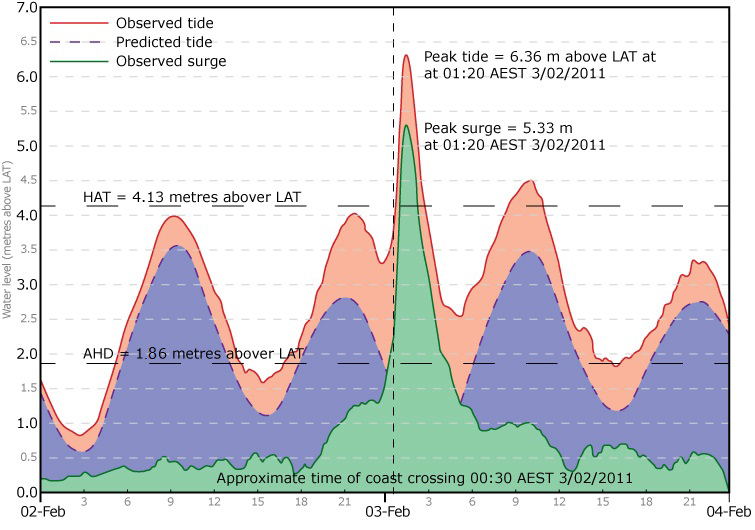
The storm tide recorded was above highest astronomical tide (HAT) and consequently there was potential threat from inundation.
The peak storm tide occurred between high and low tide as the tide was falling. Had the surge occurred at high tide, there would have been an additional 1 metre of tide, and further inundation.
This plot also shows there was additional risk to communities due to the high tide the following morning. After the storm surge, the measured level fell below HAT, only to exceed HAT shortly after, due to the influence of the next high tide.
This presented a risk to people who emerged from shelter too soon, thinking that the danger had passed. Fortunately this hazard was broadcast to communities and the risk was minimised.
Publications
We report on our storm tide data in a range of publications.
To access these publications, go to the library catalogue and search for:
- storm tide—to view a list of various types of publications from various years
- storm tide statistics—to view reports of statistics for specific regions.
Alternatively, search the library catalogue for the following publication titles:
- Storm tide warning response systems (2012)
- Queensland storm tide information resource (2007)
- Storm tide threat in Queensland: history, prediction and relative risks (1998).
Coastal Impact’s Unit Storm Tide Publications can also be found at: